DependencyFinder
For Dependency Finder version 1.4.1.
by Jean Tessier
PATHPATHThis application extracts information from compiled Java code and makes it available to users in a numbers of ways.
Many authors have stressed the importance of managing dependencies (Robert C. Martin, John Lakos). Managing dependencies means securing encapsulation and making sure that the code follows the architecture. It is also essential for the modularization of code and favors reuse. By extracting the information from the code itself, we can detect where we were sloppy, where we took shortcuts that we shouldn't have. Managing the dependencies can shorten the compilation time of the code.
This application also includes tools for computing metrics based on information extracted from compiled Java code. These measurements can be helpful to guide development and can point out areas where the code needs improvement.
Finally, this application includes a tool that computes the changes in the API of a system between successive versions. If you use third-party libraries, you can use it to verity that the parts you are depending upon have not changed. If you provide libraries to others, you can use it to ascertain the impact changes might have on your customers. You can even use it to monitor the evolution of your own software.
This project started because another project of mine became so complex that I couldn't track dependencies in my head anymore. I looked for a tool to help me and the only ones I could find were very expensive. So I resolved to build my own tool.
I haven't touched that other project since I started working on Dependency Finder.
At first, I thought of using the Reflection API, but it shows only the class's attributes and method signatures. If a method uses other classes as part of its processing, the Reflection API will not show that dependency.
Java compilers take source code and produce bytecode that they put in
.class files. The format of these files is described in
The class File Format.
I undertook to parse these files and extract the information I needed
directly from the compiled code.
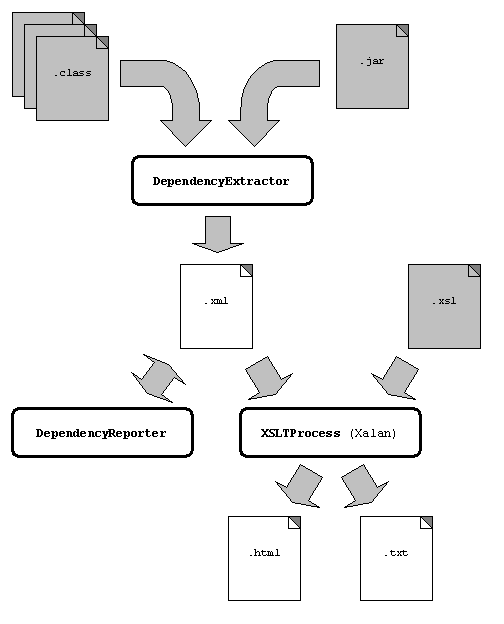
Once I had access to the code structure, I got started on tools to report interesting information about it. I started with dependencies and quickly moved up to metrics and API differences. At the beginning, the output was only to standard output or a file. Quickly, I added XSL stylesheets so it would look a little better. Eventually, I added Swing application to keep the data in memory and play with it a while.
Dependency Finder comes as a ZIP file that includes everything you need to run
it. The file is named DependencyFinder-1.4.1.bin.zip.
You need to have a Java Virtual Machine installed. You can get one for free
from Sun Microsytems. Make sure you define the
JAVA_HOME environment variable.
For example, if you installed JDK 1.5.0 in C:\jdk1.5.0:
SET JAVA_HOME=C:\jdk1.5.0
You can either add this line to your AUTOEXEC.BAT file, or on Windows NT/XP,
use Start | Settings | Control Panel | System and select the Environment tab to
create and edit variables.
Extract the ZIP file to some directory you like. The extraction will create a subdirectory named "DependencyFinder-1.4.1" that is the root of the package.
For example, if you extract it to C:\, you will end up with a directory
called C:\DependencyFinder-1.4.1\.
Create an environment variable named DEPENDENCYFINDER_HOME and have it point
to the directory where you installed Dependency Finder.
For example, if you extracted the ZIP file in C:\
SET DEPENDENCYFINDER_HOME=C:\DependencyFinder-1.4.1
You can either enter this line in your AUTOEXEC.BAT file, or on Windows NT/XP
use Start | Settings | Control Panel | System and select the Environment tab to
create and edit variables.
PATH
Add the "bin" subdirectory to your PATH variable.
For example, if you extracted the ZIP file in C:\
SET PATH=C:\DependencyFinder-1.4.1\bin;%PATH%
This is only required on Win95/98.
Under Win95/98, you will need to reboot your computer for the changes to the environment to take effect.
If the any of the tools run out of memory, try setting the
DEPENDENCYFINDER_OPTS environment variable.
SET DEPENDENCYFINDER_OPTS=-Xmx128m
If you get the message "Out of environment space" while running the scripts on
a Windows machine, you will need to add the following line to your
C:\CONFIG.SYS file and then reboot.
shell=command.com /e:8192 /p
This reserves more space for environment variables in the DOS shell. You can type:
C:\>command /?
for more details.
Dependency Finder comes as one of two compressed TAR file that includes everything you need to run it. The files are:
DependencyFinder-1.4.1.bin.tar.gzDependencyFinder-1.4.1.bin.tar.bz2Their contents are identical except of the compression algorithm used.
Tar files in the distribution contain long file names, and may require gnu tar to do the extraction.
You need to have a Java Virtual Machine installed. You can get one for free
from Linux or Solaris from Sun Microsytems. Make
sure you define the JAVA_HOME environment variable. There are distributions
of Java for most operating systems, including MacOS X.
Suppose you installed JDK 1.3 in /usr/java.
For sh:
    JAVA_HOME=/usr/java
    export JAVA_HOME
For bash:
export JAVA_HOME=/usr/java
You can put these lines in your .profile file.
For csh or tcsh:
setenv JAVA_HOME /usr/java
You can put this line in your .cshrc file.
Extract the TAR file to some directory you like. The extraction will create a subdirectory named "DependencyFinder" that is the root of the package.
$ tar xvzf DependencyFinder-1.4.1.bin.tar.gz
or
$ bunzip2 DependencyFinder-1.4.1.bin.tar.bz2 | tar xvf -
For example, if you extract it to $HOME, you will end up with a directory
called $HOME/DependencyFinder-1.4.1.
Create an environment variable named DEPENDENCYFINDER_HOME and have it point
to the directory where you installed Dependency Finder.
If the any of the tools run out of memory, try modifying the
DEPENDENCYFINDER_OPTS environment variable to allocate more memory to the JVM.
Suppose you extracted the TAR file in $HOME.
For sh:
    DEPENDENCYFINDER_HOME=$HOME/DependencyFinder-1.4.1
    export DEPENDENCYFINDER_HOME
    DEPENDENCYFINDER_OPTS=-Xmx128m
    export DEPENDENCYFINDER_OPTS
For bash:
    export DEPENDENCYFINDER_HOME=$HOME/DependencyFinder-1.4.1
    export DEPENDENCYFINDER_OPTS=-Xmx128m
You can put these lines in your .profile file.
For csh or tcsh:
    setenv DEPENDENCYFINDER_HOME $HOME/DependencyFinder-1.4.1
    setenv DEPENDENCYFINDER_OPTS -Xmx128m
You can put these lines in your .cshrc file.
PATH
Add the directory where you put the Unix scripts to your PATH variable.
Suppose you extracted the TAR file in $HOME.
For sh:
    PATH=$DEPENDENCYFINDER_HOME/bin:$PATH
    export PATH
For bash or zsh:
export PATH=$DEPENDENCYFINDER_HOME/bin:$PATH
You can put these lines in your .profile or .bashrc or .zshrc file.
For csh or tcsh:
set path = ($DEPENDENCYFINDER_HOME/bin $path)
You can put this line in your .cshrc file.
Dependency Finder also comes as a web application that you can easily deploy in just about any J2EE servlet container. Most containers have their own way to deploy and manage web applications, so you will need to adjust these instructions to your particular circumstances.
Use your favorite servlet container to deploy the WAR file. Most of them have tools for deploying WAR files. For some of them, it can be as simple as copying the WAR file to a specific directory.
For instance, using Tomcat on Windows, you can do the following:
$ ${CATALINA_HOME}/bin/shutdown
$ cp DependencyFinder-1.4.1.war ${CATALINA_HOME}/webapps
$ ${CATALINA_HOME}/bin/startup
web.xml file
Next, you need to tell the wep application where to find the dependency graph
on which it will operate. This is done via the application's context
parameters. Some application servers let you set them using some form of
application management tool. But for others, such as Tomcat, you need to edit
them manually using a text editor. You can find them in the WEB-INF/web.xml
file from the WAR file.
You will need to decide how you feed information into the web application. You can either extract the dependency graph from compiled Java code or read in a previously extracted graph. Extraction is faster, but requires that you place a copy of the compiled Java code on the server running the web application. This is often impractical, so you can generate the graph on your build machine instead and transfer only the resulting XML document.
There are six context parameters that you can adjust:
nameUsed in the JSPs to tell the users what that are looking at. Put the name of the application that you are extracting from here, it will be shown in titles by the JSPs. sourceUse this variable to tell Dependency Finder's extract.jspwhere to locate classes from which to extract a dependency graph. You can separate multiple locations by using commas. Each location can either be a JAR file, a ZIP file, a.classfile, or a directory that will be recursively searched for.classfiles.filterIncludesUse this variable to tell Dependency Finder's extract.jspwhich dependencies to include in the extracted graph. You can separate multiple regular expressions by using commas. A dependency must match at least one of them for it to be included in the graph.filterExcludesUse this variable to tell Dependency Finder's extract.jspwhich dependencies to exclude in the extracted graph. You can separate multiple regular expressions by using commas. A dependency must not match any one of them in order to be included in the graph.fileUse this variable to tell Dependency Finder's load.jspwhere to locate files which contain extracted dependency graphs. You can separate multiple locations by using commas. Each location should contain an XML document, such as the ones produced byDependencyExtractor. If you specify more than one file, their contents will be merged together.modeOptional. Tells Dependency Finder whether to minimize or maximize the resulting graph, or just leave it alone (raw, the default value). See below for the implications of minimizing or maximizing a graph.
Under some servlet containers, for example Tomcat, you will need to restart the servlet container for the changes to take effect. Other application servers may allow you to simply restart the web application itself.
$ ${CATALINA_HOME}/bin/shutdown
$ vi ${CATALINA_HOME}/webapps/DependencyFinder-1.4.1/WEB-INF/web.xml
$ ${CATALINA_HOME}/bin/startup
Or you can edit the WAR file directly and then use the deployment tool in Tomcat Manager to redeploy the web application.
You can find a pre-configured image on
Docker Hub.
It will look for code to extract dependencies from at the /code folder in the
container. All you have to do is to mount your code somewhere under /code.
Or, you can mount a pre-extracted graph as /code/df.xml.
Once you have installed Dependency Finder, you are ready to use all the tools now at your disposal. Almost all of them are Java applications that you launch using a batch file or shell script.
At the beginning, the toolset was just a group of batch files that offered a basic command-line interface (CLI). Later, I added a Swing graphical interface (GUI) that simply replicated the controls available through the CLI. Then I build a web application that mirrored the GUI. This might help explain why the the interface looks the way it does and why it may not always be very intuitive. Finally, I added a group of Ant tasks that mirror the major functions of the CLI.
We will start with the GUI-based tools, and then talk about the CLI-based tools and end with the Ant tasks.
| CLI | Ant | GUI | Web |
|---|---|---|---|
ClassDump
|
n/a | n/a | n/a |
ClassList
|
n/a | n/a | n/a |
ClassMetrics
|
<classmetrics>
|
n/a | n/a |
ClassReader
|
n/a | n/a | n/a |
ClosureToText
|
<xslt style="${dependencyfinder.home}/etc/ClosureToText.xsl">
|
n/a | n/a |
DependablesToHTML
|
<xslt style="${dependencyfinder.home}/etc/DependablesToHTML.xsl">
|
n/a | n/a |
DependablesToText
|
<xslt style="${dependencyfinder.home}/etc/DependablesToText.xsl">
|
n/a | n/a |
DependencyClosure
|
<dependencyclosure>
|
DependencyFinder >> File >> Closure
|
closure.jsp & advancedclosure.jsp
|
DependencyExtractor
|
<dependencyextractor>
|
DependencyFinder >> File >> Extract
|
extract.jsp
|
DependencyFinder
|
n/a | n/a | n/a |
DependencyGraphToHTML
|
<xslt style="${dependencyfinder.home}/etc/DependencyGraphToHTML.xsl">
|
n/a | n/a |
DependencyGraphToText
|
<xslt style="${dependencyfinder.home}/etc/DependencyGraphToText.xsl">
|
n/a | n/a |
DependencyMetrics
|
<dependencymetrics>
|
DependencyFinder >> File >> Metrics
|
n/a |
DependencyReporter
|
<dependencyreporter>
|
DependencyFinder >> File >> Dependency
|
query.jsp & advancedquery.jsp
|
DependentsToHTML
|
<xslt style="${dependencyfinder.home}/etc/DependentsToHTML.xsl">
|
n/a | n/a |
DependentsToText
|
<xslt style="${dependencyfinder.home}/etc/DependentsToText.xsl">
|
n/a | n/a |
DiffToHTML
|
<xslt style="${dependencyfinder.home}/etc/DiffToHTML.xsl">
|
n/a | n/a |
HideOutboundDependencyGraphToHTML
|
<xslt style="${dependencyfinder.home}/etc/HideOutboundDependencyGraphToHTML.xsl">
|
n/a | n/a |
HideOutboundDependencyGraphToText
|
<xslt style="${dependencyfinder.home}/etc/HideOutboundDependencyGraphToText.xsl">
|
n/a | n/a |
HideInboundDependencyGraphToHTML
|
<xslt style="${dependencyfinder.home}/etc/HideInboundDependencyGraphToHTML.xsl">
|
n/a | n/a |
HideInboundDependencyGraphToText
|
<xslt style="${dependencyfinder.home}/etc/HideInboundDependencyGraphToText.xsl">
|
n/a | n/a |
JarJarDiff
|
<jarjardiff>
|
n/a | n/a |
ListDiff
|
<listdiff>
|
n/a | n/a |
ListDiffToHTML
|
<xslt style="${dependencyfinder.home}/etc/ListDiffToHTML.xsl">
|
n/a | n/a |
ListDiffToText
|
<xslt style="${dependencyfinder.home}/etc/ListDiffToText.xsl">
|
n/a | n/a |
ListInheritanceDiffToText
|
<xslt style="${dependencyfinder.home}/etc/ListInheritanceDiffToText.xsl">
|
n/a | n/a |
ListSymbols
|
<listsymbols>
|
n/a | n/a |
ListUnused
|
<xslt style="${dependencyfinder.home}/etc/ListUnused.xsl">
|
n/a | n/a |
OOMetrics
|
<oometrics>
|
OOMetricsGUI
|
n/a |
PublishedDiffToHTML
|
<xslt style="${dependencyfinder.home}/etc/PublishedDiffToHTML.xsl">
|
n/a | n/a |
XSLTProcess
|
<xslt>
|
n/a | n/a |
c2c
|
<dependencyreporter c2c="yes">
|
DependencyFinder >> File >> Dependency
|
query.jsp & advancedquery.jsp
|
c2p
|
<dependencyreporter c2p="yes">
|
DependencyFinder >> File >> Dependency
|
query.jsp & advancedquery.jsp
|
f2f
|
<dependencyreporter f2f="yes">
|
DependencyFinder >> File >> Dependency
|
query.jsp & advancedquery.jsp
|
p2p
|
<dependencyreporter p2p="yes">
|
DependencyFinder >> File >> Dependency
|
query.jsp & advancedquery.jsp
|
The main tool is DependencyFinder. It extracts dependencies from
compiled code, maintains the dependency graph in memory, and provides
an interface for querying the graph and display the results.
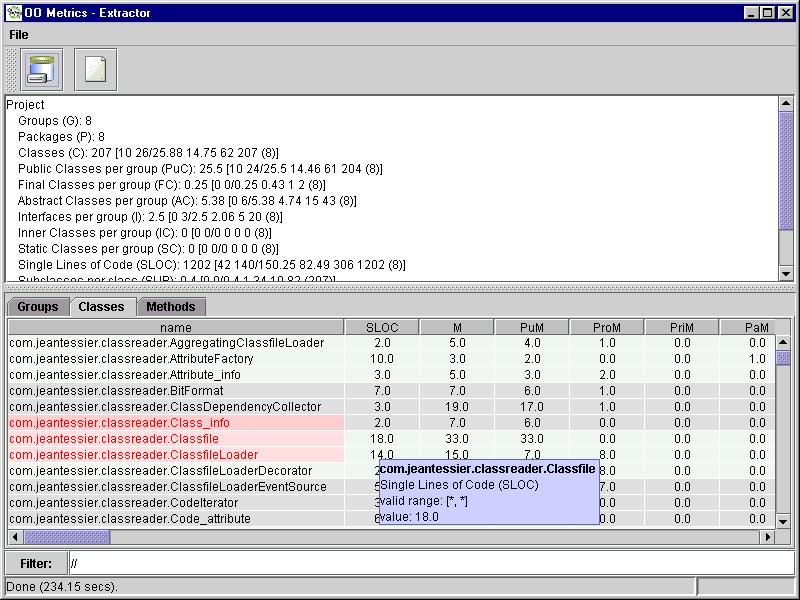
The other tool computes metrics on a given codebase. It displays results in a table with sortable columns. Different tabs control the level of detail: package, class, or method.
All the tools support -help command-line switch, which prints the list of
valid command-line switches for that particular tool. Many of the tools also
support some or all of the following five command-line switches:
-s:filenameMany of the CLI tools are automated translations of XML data into either HTML or plain text. The scripts have hard-coded XSL stylesheets. You specify the XML input with this switch. -o:filenameMany of the CLI tools are automated translations of XML data into either HTML or plain text. The scripts have hard-coded XSL stylesheets. You specify the output with this switch. -out filenameWrites the output of the command to filename. Most commands default to the standard output if you do not use -out.-timePrints the time it took to run the command. If you run commands against a large codebase or dependency graph, it can take a substantial amount of time before it returns. This information can help you plan lengthy operations in the future. -verbose [filename]Writes summary processing information to filename. If you do not specify a file, the tool will write the information to the standard output stream.
You can run the functions of the CLI as part of your build script if you are using the Ant build tool from the Apache Foundation. There is a special help page on how to use Dependency Finder with Ant.
Dependency Finder uses specialized classes to parse .class files. It also
includes some tools for looking at the contents of these files.
Use this tool to put the class in a .class file in human-readable form.
With the -xml switch, it dumps the complete structure to an XML file
that you can manipulate with your favorite XML editor.
This is a simple tally of how many classses, interfaces, methods, publics,
statics, finals, etc. there are in a given codebase. These tallies are
not as powerful as the metrics of OOMetrics, but they can give you a
rough idea of the size and complexity of a piece of software.
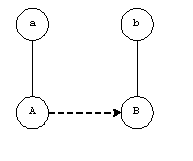
Dependencies occur when one class uses the services of another class. For example, this can happen when a class inherits from another, has an attribute whose type is of another class, or when one of its methods calls a method on an object of another class.
Knowing about dependencies is useful for programmers when evaluating the impact of a change. When you're about to rename a feature or class, it is useful to know all the places in the codebase where it is being used.
This is also useful for code reviewers and architects when assessing the coupling within an application or library.
Dependency Finder builds dependency graphs based on the information in class files.
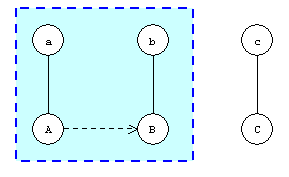
So, a dependency is when the functioning of one element A requires the
presence of another element B. We say that A depends on B and we
write it:
A --> B
We say that A has an outbound dependency while B has an inbound
dependency. It is the same dependency, but whether it is inbound or
outbound is relative to how you look at it. We also say that A is a
dependent and B is dependable.
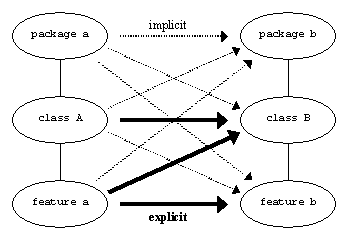
A dependency graph comprises nodes for software artifacts linked together using two types of relationships.
Artifacts are packages, classes, and features. We use the term feature to
designate class attributes, constructors, and methods; we will be treating
them the same from here on. For the purpose of analyzing dependencies, we do
not distinguish between different types of features, whether they are
constructors or regular methods, and regardless of the feature's
characteristics, such as being marked as final or static.
The first type of relationship is composition. Packages have classes, which themselves have features. We call this kind of "has a" relationship composition. A feature node is linked to its class node through composition. A class node is also linked to its package node through composition.
The second type of relationship is dependency. Classes refer to each other, features refer to each other, and features refer to classes. We call this kind of relationship dependency. Each node is linked to various other nodes of various type using dependency links.
Here is a quick example:
    public interface TestInterface {
        // Left empty on purpose
    }
In Java, every class is ultimately derived from java.lang.Object. For our
example, we would write:
    TestInterface
        --> java.lang.Object
This notation looks nice when identifiers are small, but it quickly becomes unmanageable as real-life identifiers get longer and longer. Dependency Finder uses a variation of this notation that is easier to display, read and even print when there are many dependencies at a time.
TestInterface
--> java.lang.Object
Going through class files and collecting dependencies is called extracting. The application keeps dependencies in a graph. It begins with one node per Java package. To this it adds one node per Java class (including inner classes), and to those it adds one node per feature.
Dependency Finder can read all types of compiled Java: JAR files,
ZIP files, or class files. You can point it to a JAR, ZIP, or
.class file. You can also point it to a directory and it will
explore that directory and all its subdirectories for files ending
in .class. You can select more than one target, mix and match
JARs and ZIPs and class files and directories, and Dependency
Finder will aggregate all their contents together. It will sort
them all out.
The dependencies are gathered by the class
com.jeantessier.dependency.CodeDependencyCollector. It traverses
the structure of a .class file, as read by
com.jeantessier.classreader.Classfile, and collects explicit
dependencies in the bytecode.
The dependency collector can detect three kinds of explicit dependencies, from which Dependency Finder can infer all implicit dependencies:
There are explicit dependencies, as present in the code itself. There are also implicit dependencies derived from these explicit ones. A dependency between two classes in two separate packages implies a dependency between the packages.
Here is the full dependency graph, as seen by Dependency Finder, for the
TestInterface example from before.
    public interface TestInterface {
        // Left empty on purpose
    }
        TestInterface
            --> java.lang.Object *
    java.lang *
        Object *
            <-- TestInterface
Dependency Finder uses * to distinguish identifiers that were only
referenced in the code it analyzed, as opposed to concrete symbols that it
actually encountered. In this case, we only analyzed TestInterface and not
Object, so as far Dependency Finder is concerned, the actual existence of
Object is only an unconfirmed rumor. At runtime, the virtual machine will
have to somehow resolve this reference to an actual class, but we do not need
to do this for our purposes.
Here is another, slightly more complex example:
    public class ParentClass {
        public void a() {
            // Left empty on purpose
        }
    }

    public class ChildClass extends ParentClass {
        public void b() {
            a();
        }
    }
        ChildClass
            --> ParentClass
            ChildClass()
                --> ParentClass.ParentClass()
            a(): void *
                <-- ChildClass.b(): void
            b(): void
                --> ChildClass.a(): void *
        ParentClass
            <-- ChildClass
            --> java.lang.Object *
            ParentClass()
                <-- ChildClass.ChildClass()
                --> java.lang.Object.Object() *
            a(): void
    java.lang *
        Object *
            <-- ParentClass
            Object() *
                <-- ParentClass.ParentClass()
Here, the implicit constructor for ChildClass calls the implicit constructor
for ParentClass (which in turn calls the default constructor for Object).
So there is a dependency:
ChildClass.ChildClass() --> ParentClass.ParentClass()
These constructors were created by the compiler, but they are actual methods in the bytecode for their respective class. Dependency Finder considers them concrete programming elements.
We also see that the method b() calls the inherited method a(). There is
a dependency:
ChildClass.b() --> ChildClass.a()
But there is no actual method a() in ChildClass, so Dependency Finder marks
it as referenced only using a *. The actual method a() in ParentClass
does not have any direct dependency on it, but the virtual machine will resolve
the calls to ChildClass.a() as calls to ParentClass.a() at runtime.
Up until JDK 1.3, the compiler would have resolved the call to a() to the
definition in ParentClass. This works fine until later versions of classes
start overriding a(). Let us imaging a class MiddleClass that sits
between ParentClass and ChildClass in the inheritance hierarchy. At first,
neither MiddleClass nor ChildClass override a(), so the compiler would
resolve the method call to the version in ParentClass. If we later
substitute a new version of MiddleClass that overrides a() but we do not
recompile ChildClass, it will mistakenly use the version in ParentClass
instead of the correct version in MiddleClass. The compiler in JDK 1.4 and
forward no longer tries to resolve references to symbols to prevent this
problem from occurring.
Here is what the dependency graph would look like, using the JDK 1.3 compiler.
        ChildClass
            --> MiddleClass
            ChildClass()
                --> MiddleClass.MiddleClass()
            b(): void
                --> ParentClass.a(): void
        MiddleClass
            <-- ChildClass
            --> ParentClass
            MiddleClass()
                <-- ChildClass.ChildClass()
                --> ParentClass.ParentClass()
            a()
        ParentClass
            <-- MiddleClass
            --> java.lang.Object *
            ParentClass()
                <-- MiddleClass.ChildClass()
                --> java.lang.Object.Object() *
            a(): void
                <-- ChildClass.b(): void
    java.lang *
        Object *
            <-- ParentClass
            Object() *
                <-- ParentClass.ParentClass()
Dependency Finder analyzes compiled Java code, and as a result it is at the mercy of the information produced by the compiler. Some of the following limitations are the result of using Sun's compiler that comes with the JDK. But I will start with one limitation that applies regardless of the compiler.
If we look closely at this model, we see that recursive method calls and certain types of recursive structures can generate dependencies between a programming elemend (i.e., a class or a method) and itself. Or, if a method has a parameter or local variable whose type is the enclosing class itself, or if an attribute's type is its enclosing class, this introduce a dependency from the feature to the class of which it is a part of.
Dependency Finder does not keep track of dependencies on self. Dependency analysis is useful for two things:
You use compile-time dependency, or change impact analysis, to answer questions such as "If I change X, what else might I have to change too?" Dependencies on self are not all that useful here. If I am changing X, I don't need to be told that X will be impacted. Likewise, if I am making changes to features of a class, I don't need to be told that the class will be impacted; I am already editing it. I do, however, need to know what other features in this class might be impacted.
You use runtime dependency analysis to answer questions such as "For class X to run, what other classes do I need?" The class as a whole is the unit of loading. If a feature needs its class, the class is forcibly already loaded otherwise the JVM would never had gotten to the feature to begin with. Likewise, if a class needs itself, well it is already there.
So Dependency Finder does not keep track of dependencies on self. This includes implicit dependencies from a class or feature to its package, or from a package to itself.
Very often, Dependency Finder cannot track dependencies on final fields whose
type is either a primitive type or String.
In Java, you can define constants in classes and interfaces by marking them
as final. No one can change the value because it is final, not even
subclasses. As a result, the compiler can use local optimizations to speed up
execution. When these constants are of primitive types or String, the
compiler can inline the value directly in the client class, so that it makes
no reference at all to the class that owns the constant. Even when the client
is the class itself, the compiler can inline the value directly and save the
field lookup.
Under these circumstances, Dependency Finder cannot track dependencies on
simple constants that are referenced from outside their class. If the constant
are of some object type other than String, the compiler cannot perform the
optimization and Dependency Finder will be able to track dependencis on them.
Dependency Finder does not track the type of local variables in methods.
The compiler does not need to keep track of the type of local variables. It validates the assignment and then discards type information. The virtual machine will validate the bytecode and make sure that it was not tampered with. The compiler makes sure that an assignment to a local variable is type-safe. Any method call on the variable will be made either on an interface or a class that is compatible with the type of the local variable.
Most compilers have options to retain information about local variables,
such as their name and type. With javac, you have to supply the -g
switch. Doing this helps symbolic debuggers give more useful context
information to their users.
Given all this, it barely matters if Dependency Finder tracks dependencies on the type of local variables very closely. Assignments will to objects whose type eventually reaches the exact type of the variable, and method calls will be made on that type's set of methods. Dependency Finder loses no information by ignoring possible local variables, just a little precision. And since the virtual machine does not use that information, it does not impact runtime dependencies anyway.
Dependency Finder does not track the line numbers where dependencies occur.
First, the dependency graph records a given dependency only once, regardless of
how many times it is present in the code. If a method a() calls another
method b() more than once, there is only one edge in the graph. Right now,
the graph does not use separate objects to represent the dependency to save on
memory footprint, so the graph cannot record dependency-specific details, such
as how many times it occurred or on which line it occurred.
Second, Dependency Finder works on compiled code and the compiler leaves very
little as far as line numbers are concerned. The only information available is
the LineNumberTable attribute, part of the Code attribute, which is itself
part of the Method_info structure inside the .class file. The
LineNumberTable attribute is optional and "javac" will not include it if you
use the -g:none option. And even when it does include that attribute, the
information is not always useful.
You can do a quick test with the following class. The listing shows line numbers to help illustrate the point.
    1: public class A {
    2:     public void f1() {
    3:         // Do nothing
    4:     }
    5: }
The compiled class has two methods: an implicit constructor A() and the method
f1(). The constructor has a single entry in its LineNumberTable attribute
stating that it starts on line 1. But from the listing, we see no constructor
on line 1, so this line number information is misleading. The method also has a
single entry in its LineNumberTable attribute stating that its return
statement is on line 4. But there is only a closing brace on line 4, so this
line number information is also misleading.
The .class file does not contain line number information for:
Code attribute)For these reasons, Dependency Finder does not do anything with line numbers, since the information is sketchy and what little is there is hard to work with. Other tools usually generate their own parse tree of the original Java code so they can precisely pinpoint declarations
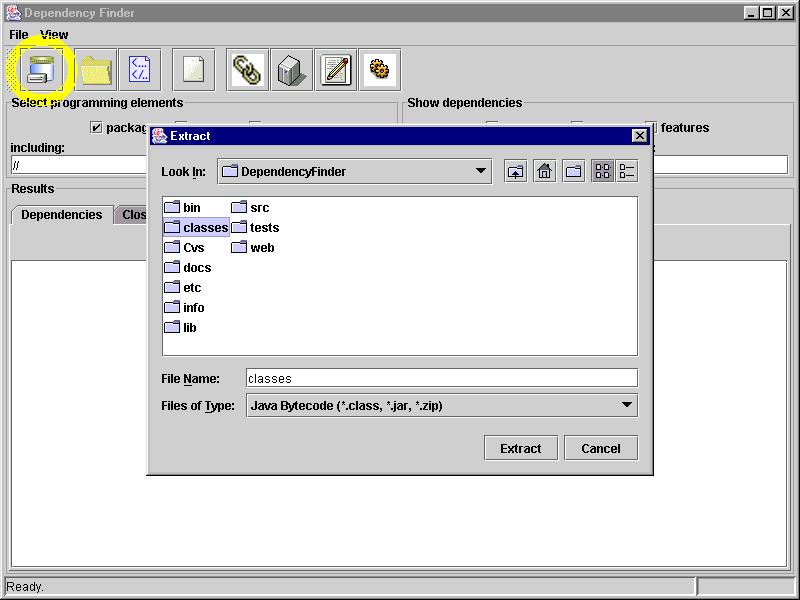
Select File | Extract; this will popup a file dialog.
Select the files and/or directories to extract from and click Extract.
You can repeat this command as often as needed; each time, the extracted
dependencies will be added to the current dependency graph in memory.
You can save the current dependency graph to an XML file by using
File | Save. You can later reload the graph by using
File | Open. Note that it is usually faster to extract the
information again from class files than to load it from an XML file.
You use DependencyExtractor to extract dependencies. Simply string
out the files and directories on the command-line. All the dependencies
are merged into a single output.
    $ DependencyExtractor classes
                          ${JAVA_HOME}/JRE/lib/rt.jar
You can specify an output file with the -out switch:
    $ DependencyExtractor -out df.txt
                          ${DEPENDENCYFINDER_HOME}/lib/DependencyFinder.jar
You can save the graph to XML with the -xml switch:
    $ DependencyExtractor -xml -out df.xml
                          ${DEPENDENCYFINDER_HOME}/lib/DependencyFinder.jar
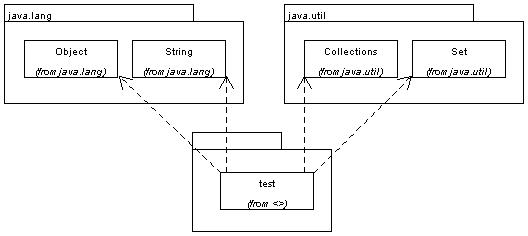
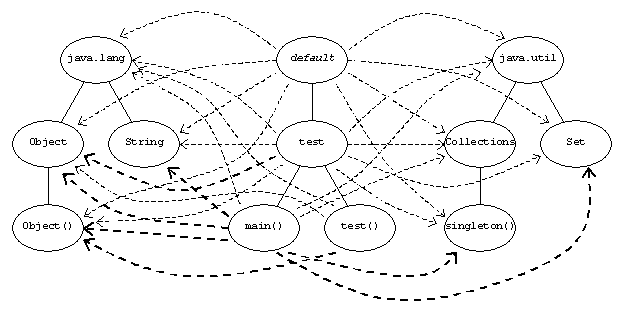
Here is a simple, concrete example. We start with a trivial Java class in
the file test.java and compiled into test.class.
import java.util.*;
    public class test {
        public static void main(String[] args) {
            Collection c = Collections.singleton(new Object());
        }
    }
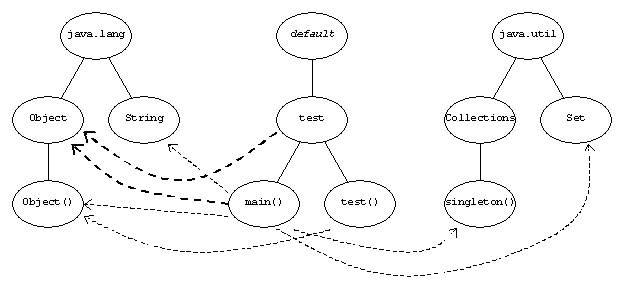
Here is the raw output dependency graph.
$ DependencyExtractor test.class
        test
            --> java.lang.Object *
            main(java.lang.String[]): void
                --> java.lang.Object *
                --> java.lang.Object.Object() *
                --> java.lang.String *
                --> java.util.Collections.singleton(java.lang.Object): java.util.Set *
                --> java.util.Set *
            test()
                --> java.lang.Object.Object() *
    java.lang *
        Object *
            <-- test
            <-- test.main(java.lang.String[]): void
            Object() *
                <-- test.main(java.lang.String[]): void
                <-- test.test()
        String *
            <-- test.main(java.lang.String[]): void
    java.util *
        Collections *
            singleton(java.lang.Object): java.util.Set *
                <-- test.main(java.lang.String[]): void
        Set *
            <-- test.main(java.lang.String[]): void
We can save it to an XML document for use with the other tools.
    $ DependencyExtractor -xml -out test.xml
                          test.class
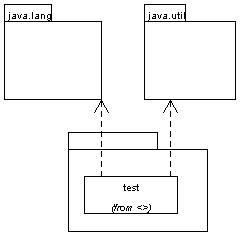
And narrow down the graph to class-to-class dependencies.
$ c2c -scope-includes /test/ test.xml
        test
            --> java.lang.Object *
            --> java.lang.String *
            --> java.util.Collections *
            --> java.util.Set *
c2c is a shortcut for a set of switches to DependencyReporter. All the
following commands are equivalent.
    $ c2c -scope-includes /test/
          test.xml
    $ c2c -class-scope-includes /test/
          test.xml
    $ DependencyReporter -c2c
                         -class-scope-includes /test/
                         test.xml
    $ DependencyReporter -class-scope
                         -class-scope-includes /test/
                         -class-filter
                         test.xml
For fun, I entered manually this graph description into Poseidon for UML.
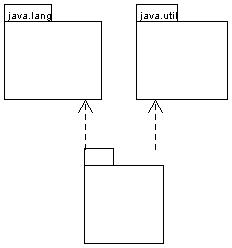
We can narrow the graph further to class-to-package dependencies. Again, all these commands are equivalent.
    $ c2p -scope-includes /test/
          test.xml
    $ c2p -class-scope-includes /test/
          test.xml
    $ DependencyReporter -c2p
                         -scope-includes /test/
                         test.xml
    $ DependencyReporter -class-scope
                         -class-scope-includes /test/
                         -package-filter
                         test.xml
        test
            --> java.lang *
            --> java.util *
Finally, a package-to-package dependency graph. All these commands are equivalent.
$ p2p test.xml
    $ DependencyReporter -p2p
                         test.xml
    $ DependencyReporter -package-scope
                         -package-filter
                         test.xml
        --> java.lang *
        --> java.util *
    java.lang *
        <--
    java.util *
        <--
The web application can get a dependency graph from either compiled Java code
or an XML document. The graph will stay in memory for the lifetime of the
process serving the application, or until you reload it. This graph can get
pretty big, so make sure you allocate enough memory to the application server.
This is why the two pages you use to get the graph in memory, extract.jsp and
load.jsp, are not linked into the navigation structure of the web
application. These operations can take a long time and consume vast amounts of
memory. Casual users should not launch them in an uncoordinated fashion or
they could bring down the server. It is best to have a designated
administrator who can best decide when it is appropriate to refresh the data in
the web application.
You use extract.jsp to generate a dependency graph from compiled Java code.
If you just call extract.jsp, it will print statistics on the current graph,
if any. These include the number of nodes in the graph, how long it took to
extract it, and a timestamp of when it was extracted.
If you click on the Launch button, or call extract.jsp?launch=Launch, it
will start to extract a new dependency graph. The previous one will remain in
use for other callers until the extraction terminates successfully. The JSP
prints the name of classes as it extracts them. And at the end, it prints how
many classes it read and how long it took to analyze them.
When there is already a graph present, extract.jsp shows a checkbox asking
you if you just want to update the current graph instead of loading it from
scratch. If the codebase is large, it can take a few minutes to extract a
complete graph from it. If you just recompiled a class or two, you can ask the
web application to simply pick up the changes and apply them to the current
graph instead, which takes a lot less time. Just leave the checkbox checked
before you click on the Launch button.
You can use the URL "extract.jsp?launch=Launch" to automatically update the
graph after automated compilation runs, such as during nightly builds. It
always extracts a brand new graph from scratch.
    <target name="extract" depends="init">
        <get src="${WEB_APP_URL}/extract.jsp?launch=Launch"
             dest="log.html"/>
    </target>
You use load.jsp to read a dependency graph from an XML document such as the
ones generated by DependencyExtractor. If you just call load.jsp, it will
print statistics on the current graph, if any. These include the number of
nodes in the graph, how long it took to read it, and a timestamp of when it was
extracted.
If you click on the Launch button, or call load.jsp?launch=Launch, it
will start to read a new dependency graph. The previous one will remain in use
for other callers until the loading terminates successfully. The JSP prints
the name of classes as it reads them. And at the end, it prints how many files
it read and how it took to read them.
You can use the URL "load.jsp?launch=Launch" to automatically update the
graph after automated compilation runs, such as during nightly builds.
    <target name="load" depends="init">
        <get src="${WEB_APP_URL}/load.jsp?launch=Launch"
             dest="log.html"/>
    </target>
You use the com.jeantessier.dependencyfinder.ant.DependencyExtractor task to
extract a graph as part of your build. You need to associate the class to a
tag using Ant's <taskdef> task. You also need to tell Ant where to
find the Dependency Finder classes. There is a special
help page on how to do this.
    <target name="extract" depends="init">
        <dependencyextractor destfile="df.xml" xml="yes">
            <path>
                <pathelement location="."/>
            </path>
        </dependencyextractor>
        <xslt style="${dependencyfinder.home}/etc/DependencyGraphToHTML.xsl"
              in="df.xml"
              out="df.html"/>
    </target>
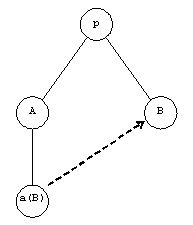
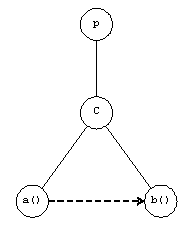
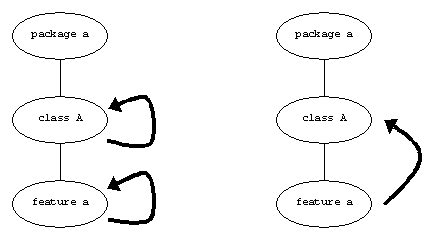
It is often the case that an explicit dependency in the code can be implied from another explicit dependency in that code. For example, take the following code snippet:
    class A extends B {
        public void a() {
            b();
        }
    }
    class B {
        public void b() {}
    }
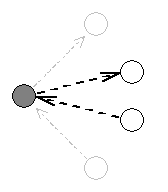
We can analyze the dependencies. A is a subclass of B, so there is a
dependency A --> B. And A.a() calls b(), which is defined
in B, yielding the dependency A.a() --> B.b(). Here is a
subset of the resulting dependency graph:
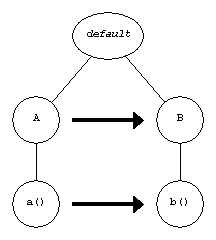
Clearly, the dependency A.a() --> B.b() implies the dependency
A --> B. We say that the latter is redundant; it does not
add anything to the overall connectivity of the graph. Another, very
frequent, example of this situation occurs with constructors.
    class A extends B {}
    class B {}
Another variation occurs when a method either calls a method on an object
it received as a parameter or throws a new Exception that is part of
its throws clause.
    class A {
        public void a(B b) {
            b.b();
        }
    }
    class B {
        public void b() {}
    }

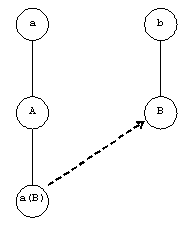
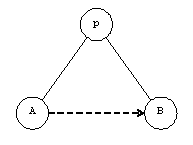
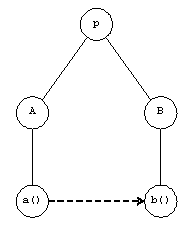
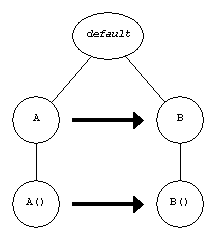
We minimize the dependency graph when we remove redundant dependencies.
In the first example above, we would remove the dependency
A --> B. Here is what would be the resulting graph:

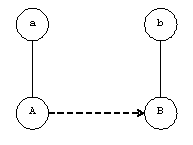
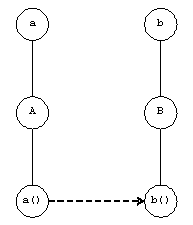
We maximize the dependency graph when we expose all implicit dependencies
by making them explicit. Staying with our example,
A.a() --> B.b(), maximizing it would introduce these
dependencies:
A.a() --> BA --> B.b()A --> B
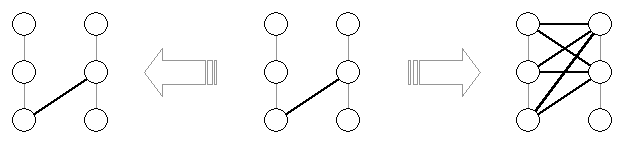
Maximizing and minimizing a dependency graph deals with the trade off between space and time. Minimizing the graph saves on space, but it takes longer to traverse the graph to find if there is a dependency between two given nodes. Maximizing the graph saves on time, since all the dependencies are there for the picking, but the size of the graph goes up dramatically.
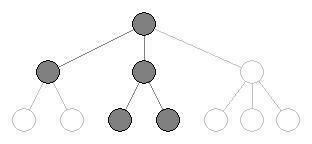
The illustrations below show how combinations of these are minimized or maximized. You can minimize a graph that has been maximized and obtain the same minimized graph as if you had minimized the original graph. Similarly, if you maximize a graph that has been minimized, you end up with the same graph as if you had minimized the original graph.


Here is a simple, concrete example. We start with a our trivial Java class from before.
import java.util.*;
    public class test {
        public static void main(String[] args) {
            Collection c = Collections.singleton(new Object());
        }
    }
Let's start with the obvious dependencies. test.main() has a parameter
that's a String array, a local variable of type Collection, calls the
no-arg constructor for Object, and calls a static method on Collections.
That's four so far. Also, since test extends Object by default, that's
one more dependency. It also gets an implicit no-arg constructor that calls
Object's no-arg constructor. We are now up to six dependencies.
The compiler does not keep track of local variables unless you call it with
the -g switch. This means we are not guaranteed to find the dependency
test.main(java.lang.String[]) --> java.util.Collection by simply
looking at compiled code. But we can examine the signature of singleton()
and since we have to call it, we'll need to get objects of these types.
The method takes a parameter of type Object and returns a Set. This
last one makes up for our losing Collection earlier since Set extends
Collection.
Total: seven dependencies.
The redundant dependencies are shown in bold. We can remove them by minimizing the graph.

Or, we can maximize the graph. The bold dependencies below show the original
dependencies. If the graph gets this complicated for something as trivial as
test.java, imagine what your code will look like.
Here are the dimensions of various graphs.
| Software | Artifacts | Dependencies | ||||||
| Packages | Classes | Features | Minimized | Raw | Maximized | |||
test.java |
3 | 5 | 4 | 5 | (-29%) | 7 | 27 | (+286%) |
| Jakarta-ORO | 9 | 101 | 835 | 2,301 | (-13%) | 2,652 | 4,641 | (+75%) |
| Log4J | 44 | 542 | 3,331 | 10,880 | (-16%) | 12,961 | 27,215 | (+110%) |
| Xerces | 51 | 880 | 11,218 | 38,194 | (-13%) | 43,893 | 80,472 | (+83%) |
| Xalan | 58 | 855 | 10,763 | 35,317 | (-15%) | 41,594 | 81,745 | (+97%) |
| Ant | 38 | 568 | 5,635 | 22,057 | (-16%) | 26,184 | 50,585 | (+93%) |
| Ant w/ optional | 113 | 1,117 | 10,854 | 42,140 | (-16%) | 50,165 | 99,178 | (+98%) |
| Dependency Finder | 27 | 364 | 3,587 | 13,098 | (-18%) | 15,897 | 28,923 | (+82%) |
Reporting means displaying a dependency graph. More often than not, the graph on display is a subset of a larger graph. A graph is composed of nodes and links. When we display a subset of a graph, we must choose which nodes and which links to include in the subset. We use Perl regular expressions to indicate what we are interested in.
So, reporting deals with selecting a subset of the dependency graph; that is, choosing a subset of the nodes making up the graph and a subset of the links to or from these nodes. The scope selects the nodes in the source graph that will be copied into the destination graph. We then filter the links (i.e., the dependencies) to or from nodes in the scope that will be copied into the destination graph. We must also copy the nodes at the other end of these link if they were not already in the destination graph.
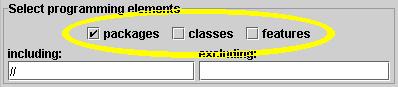
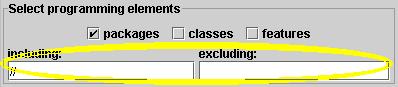
We use the term scoping when talking about the selection process for nodes. The GUI and the JSPs have a section labeled "Select programming elements" to group the controls that govern scoping.
We use the term filtering when talking about the selection process for links. The GUI and the JSPs have a section labeled "Show dependencies" to group the controls that govern filtering.
Now both scoping and filtering have similar user interfaces. I will talk about the one for scoping here, but the filtering interface works the same way.
First, a set of checkboxes narrow the search to only packages, classes, features, or combinations thereof. In the CLI, you achieve the same effect through command-line switches.
    $ DependencyReporter -package-scope
                         -class-scope
                         -feature-scope
$ DependencyReporter -f2f
Secondly, you specify Perl regular expressions in an including and an excluding text fields. A node must match the regular expressions in the including field and not match the ones in the excluding field. You can put multiple regular expressions in each field, separate them with commas and they will be or'ed together. On the command-line, just repeat the switches.
    $ DependencyReporter \
        -scope-includes // \
        -scope-excludes /Test/
The selective graph copier uses Perl regular expressions to select scoped nodes and filtered dependencies.
I will give here a brief introduction to regular expression syntax here. Here are links to pages that explain Perl regular expressions in more details:
Regular expressions are strings that get matched against package, class, and
feature names. They must be surrounded by a "/" on each side. This is in
part because the package that implements them demands it. But it is also a way
to remind you that these strings are Perl regular expressions: you have access
to the full expressiveness of Perl pattern-matching.
Most characters in the regular expression match themselves. /foobar/ matches
the string "foobar" anywhere in the node's name.
Some characters, however, have special meaning. "." will match any character
at that position. /foo.bar/ will match "fooabar" and "foo/bar" and even
"foo.bar", but not "foobar" since there is no character between the second "o"
and the "b".
Another special character is "\". It is used to escape special characters
and to turn regular characters into special ones. For instance, "(" and
")" are special characters; to match them in a method name, you have to
escape each one with a "\", as in /foobar\(\)/. "s" usually matches the
letter "s" but "\s" will match any whitespace character, such as a space or a
tab.
Special characters in regular expressions:
[A-Z]Capitals \wAlphanumerics [A-Za-z0-9_] \WNon-alphanumerics [^A-Za-z0-9_] \w+At least one alphanumeric \sSpace, including tab, carriage return, and line feed \s*Zero or more white space \.Matches '.', as opposed to any character
Sample rules:
//Matches everything. /abc/Matches anything with " abc" in it. Case-sensitive./abc/iMatches anything with " abc" in it. Case-insensitive./^abc/Matches anything starting with " abc" in it./abc\(/Matches anything with " abc(" in it. Parentheses are special characters in Perl regular expressions and must be escaped with a backslash "\" character.
Examples:
/java/Matches anything with " java" in it./^java/Matches anything that starts with " java"./^com.jeantessier/Matches anything that starts with " com.jeantessier". Here, the '.' really matches any single character, which obviously includes the '.' character itself./Node.Accept\(/Matches any Accept()method of any class ending in "Node"./Test/Matches anything with " Test" in it./(Node)\.\1\(/Matches any constructor for Node./(\w*Measurement)\.\1\(/Matches any constructor for classes ending in Measurement.
So far, we have seen an interface where the Perl regular expressions apply to all software artifacts, regardless of whether they are packages, classes, or features. Dependency Finder has a more elaborate interface, called the advanced view, which allows you to specify regular expressions that apply only to packages, or only to classes, or only to features.
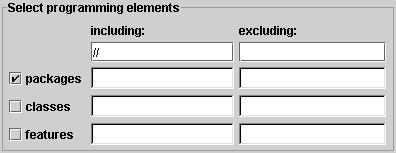
The checkboxes to select packages, classes, and features are arrayed on the left of the user interface. The text fields next to each one are for regular expressions that will apply only to that type of programming element or software artifact. The top field in each column is from the simple view and applies to all artifacts.
We achieve the same effect in the CLI by using multiple switches. For
instance, -feature-scope-includes is for the "including" field in the
"Select programming elements" group that applies only to features. It is
used in scoping feature nodes, if you use it along with -feature-scope.
    $ DependencyReporter -package-scope
                         -class-scope
                         -feature-scope
$ DependencyReporter -f2f
$ DependencyReporter -scope-includes //
    $ DependencyReporter -scope-includes //
                         -scope-excludes /Test/
                         -feature-scope-includes /someMethod/
                         -feature-scope-includes /anotherMethod/
Inbound dependencies show you who depends on a given programming element. They are very useful when assessing the impact of a change. Dependency Finder uses a textual notation to display them:
    programming element
        <-- dependent 1
        <-- dependent 2
            ...
When there are a lot of dependencies, either because the graph is very big or an element is highly connected, it is useful to filter out the other dependencies so that inbound ones stand out and are easier to read.
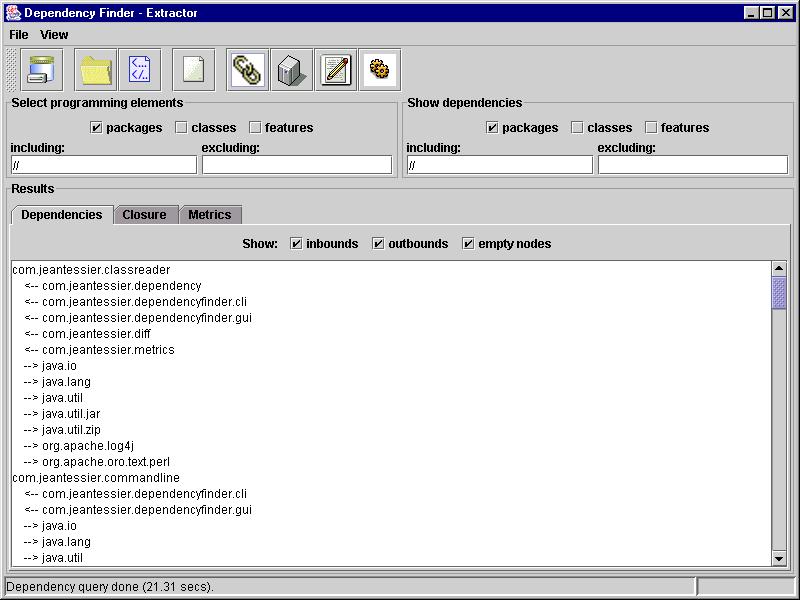
In DependencyFinder and the web application, there are three checkboxes
at the bottom of the control area. They control how the graph is rendered.
To see only inbound dependencies, check the one labeled "inbounds" and
uncheck the one labeled "outbounds". If a node has no inbound dependencies,
it will appear empty. You can remove empty nodes by unchecking the last
checkbox, the one labeled "empty nodes".
If you are using the command-line tools, DependencyReporter has switches
matching the checkboxes from the GUI and web application. You can use it with
-show-inbounds, with or without -show-empty-nodes. The Ant task also has
matching attributes.
Another option with command-line tools, what you have to work from is most
likely a graph rendered in XML, either from DependencyExtractor or
DependencyReporter. You can use XML stylesheets to convert the XML to
something more user-friendly. Dependency Finder provides two sample
stylesheets to show only nodes with inbound dependencies. You can apply them
with the following tools:
DependablesToTextDependablesToHTML
$ DependablesToText -s:test.xml
    java.lang *
        java.lang.Object *
            <-- test
            <-- test.main(java.lang.String[]): void
            java.lang.Object.Object() *
                <-- test.main(java.lang.String[]): void
                <-- test.test()
        java.lang.String *
            <-- test.main(java.lang.String[]): void
    java.util *
        java.util.Collections *
            java.util.Collections.singleton(java.lang.Object): java.util.Set *
                <-- test.main(java.lang.String[]): void
        java.util.Set *
            <-- test.main(java.lang.String[]): void
The HTML version weaves cross-references between all the elements for easy navigation.
If you only want to remove outbound dependencies and keep empty nodes, use:
HideOutboundDependenciesToTextHideOutboundDependenciesToHTML
$ HideOutboundDependenciesToText -s:test.xml
        test
            test.main(java.lang.String[]): void
            test.test()
    java.lang *
        java.lang.Object *
            <-- test
            <-- test.main(java.lang.String[]): void
            java.lang.Object.Object() *
                <-- test.main(java.lang.String[]): void
                <-- test.test()
        java.lang.String *
            <-- test.main(java.lang.String[]): void
    java.util *
        java.util.Collections *
            java.util.Collections.singleton(java.lang.Object): java.util.Set *
                <-- test.main(java.lang.String[]): void
        java.util.Set *
            <-- test.main(java.lang.String[]): void
Outbound dependencies show you who a given programming element depends upon. They are very useful when partitioning programming elements and figuring out what other classes a given class needs in order to run. Dependency Finder uses a textual notation to display them:
    programming element
        --> dependable 1
        --> dependable 2
            ...
When there are a lot of dependencies, either because the graph is very big or an element is highly connected, it is useful to filter out the other dependencies so that outbound ones stand out and are easier to read.
In DependencyFinder and the web application, there are three checkboxes
at the bottom of the control area. They control how the graph is rendered.
To see only outbound dependencies, check the one labeled "outbounds" and
uncheck the one labeled "inbounds". If a node has no outbound dependencies,
it will appear empty. You can remove empty nodes by unchecking the last
checkbox, the one labeled "empty nodes".
If you are using the command-line tools, DependencyReporter has switches
matching the checkboxes from the GUI and web application. You can use it with
-show-outbounds, with or without -show-empty-nodes. The Ant task also has
matching attributes.
Another option with the command-line tools, what you have to work from is most
likely a graph rendered in XML, either from DependencyExtractor or
DependencyReporter. You can use XML stylesheets to convert the XML to
something more user-friendly. Dependency Finder provides two sample
stylesheets to show only outbound dependencies. You can apply them with the
following tools:
DependentsToTextDependentsToHTML
$ DependentsToText -s:test.xml
        test
            --> java.lang.Object *
            test.main(java.lang.String[]): void
                --> java.lang.Object *
                --> java.lang.Object.Object() *
                --> java.lang.String *
                --> java.util.Collections.singleton(java.lang.Object): java.util.Set *
                --> java.util.Set *
            test.test()
                --> java.lang.Object.Object() *
The HTML version weaves cross-references between all the elements for easy navigation.
If you only want to remove inbound dependencies and keep empty nodes, use:
HideInboundDependenciesToTextHideInboundDependenciesToHTML
$ HideInboundDependenciesToText -s:test.xml
        test
            --> java.lang.Object *
            test.main(java.lang.String[]): void
                --> java.lang.Object *
                --> java.lang.Object.Object() *
                --> java.lang.String *
                --> java.util.Collections.singleton(java.lang.Object): java.util.Set *
                --> java.util.Set *
            test.test()
                --> java.lang.Object.Object() *
    java.lang *
        java.lang.Object *
            java.lang.Object.Object() *
        java.lang.String *
    java.util *
        java.util.Collections *
            java.util.Collections.singleton(java.lang.Object): java.util.Set *
        java.util.Set *
You can combine the two approaches we just looked at and display the full graph. For the sake of brevity, when a node A depends on a node B and that node B also depends on node A, Dependency Finder writes it as:
    A
        <-> B
    B
        <-> A
If you are using the command-line tools, DependencyReporter has switches
matching the checkboxes from the GUI and web application. You can use it with
both -show-inbounds and -show-outbounds, with or without
-show-empty-nodes. All three are on if you don't specify anything. The Ant
task also has matching attributes.
Another option with the command-line tools, what you have to work from is most
likely a graph rendered in XML, either from DependencyExtractor or
DependencyReporter. You can use XML stylesheets to convert the XML to
something more user-friendly. Dependency Finder provides two sample
stylesheets to show whole dependency graphs. You can apply them with the
following tools:
DependencyGraphToTextDependencyGraphToHTMLThe HTML version weaves cross-references between all the elements for easy navigation.
$ DependencyGraphToText -s:test.xml
        test
            --> java.lang.Object *
            test.main(java.lang.String[]): void
                --> java.lang.Object *
                --> java.lang.Object.Object() *
                --> java.lang.String *
                --> java.util.Collections.singleton(java.lang.Object): java.util.Set *
                --> java.util.Set *
            test.test()
                --> java.lang.Object.Object() *
    java.lang *
        java.lang.Object *
            <-- test
            <-- test.main(java.lang.String[]): void
            java.lang.Object.Object() *
                <-- test.main(java.lang.String[]): void
                <-- test.test()
        java.lang.String *
            <-- test.main(java.lang.String[]): void
    java.util *
        java.util.Collections *
            java.util.Collections.singleton(java.lang.Object): java.util.Set *
                <-- test.main(java.lang.String[]): void
        java.util.Set *
            <-- test.main(java.lang.String[]): void
This table summarizes which CLI tool shows which information.
Tool outbounds inbounds empty DependencyGraphToHTML
DependencyGraphToTextX X X DependablesToHTML
DependablesToText- X - DependentsToHTML
DependentsToTextX - - HideOutboundDependenciesToHTML
HideOutboundDependenciesToText- X X HideInboundDependenciesToHTML
HideInboundDependenciesToTextX - X
Sometimes the codebase can be too large for Dependency Finder to deal with it in one pass. The dependency graph can become so large that it uses up all available memory. This can be the case either on a large project or when you try to build a graph across many applications. You can ease this situation by:
If you have multiple JAR files, you can simply process them individually.
If you have one large JAR file, you can extract it to a temporary location and put the files in smaller groups, such as related packages rooted at some directory.
A quick and dirty way of splitting the JAR: extract it to a folder somewhere and run DependencyReporter on the subfolders.
For example, using DependencyFinder.jar:
% jar xf DependencyFinder.jar com
You can analyze the major package groups as follow:
    % DependencyExtractor -xml -out classreader.xml
                          com/jeantessier/classreader
    % DependencyExtractor -xml -out dependency.xml
                          com/jeantessier/dependency
    % DependencyExtractor -xml -out dependencyfinder.xml
                          com/jeantessier/dependencyfinder
    % DependencyExtractor -xml -out diff.xml
                          com/jeantessier/diff
    % DependencyExtractor -xml -out metrics.xml
                          com/jeantessier/metrics
To save on memory, DependencyExtractor uses a TransientClassfileLoader: it
reads classes in one at a time and discards them before moving on to the next.
So the real problem is the size of the resulting graph. If you do only steps
1, 2, and 4 above, without the reduction stop, DependencyReporter will
aggregate multiple graphs when you give it all the XML files but the resulting
graph will still be as big as if you had just run DependencyExtractor once on
the original codebase.
Here's a variation on this idea. Run DependencyReporter with -c2c on the
intermediary graphs to generate small class-to-class graphs.
    % DependencyReporter -xml -out classreader.c2c.xml
                         -c2c
                         classreader.xml
    % DependencyReporter -xml -out dependency.c2c.xml
                         -c2c
                         dependency.xml
    % DependencyReporter -xml -out dependencyfinder.c2c.xml
                         -c2c
                         dependencyfinder.xml
    % DependencyReporter -xml -out diff.c2c.xml
                         -c2c
                         diff.xml
    % DependencyReporter -xml -out metrics.c2c.xml
                         -c2c
                         metrics.xml
Then combine all these small graphs with a last pass of DependencyReporter to
aggregate all the little ones into an all-encompassing class-to-class graph.
    % DependencyReporter -xml -out c2c.xml
                         -c2c
                         classreader.c2c.xml
                         dependency.c2c.xml
                         dependencyfinder.c2c.xml
                         diff.c2c.xml
                         metrics.c2c.xml
This approach shows an 80%-90% reduction in number of nodes and about 80% in the number of edges (dependencies). Taken together, that's a 98% reduction in complexity. This should help with both memory footprint and processing time.
| Graph | Nodes | Dependencies | Nodes x Dependencies | ||||||
| Packages | Classes | Features | Total | ||||||
classreader.xml |
8 | 112 | 1,078 | 1,198 | 4,042 | 4,842,316 | |||
classreader.c2c.xml |
8 | 112 | 0 | 120 | (-90%) | 809 | (-80%) | 97,080 | (-98%) |
commandline.xml |
3 | 34 | 204 | 241 | 545 | 131,345 | |||
commandline.c2c.xml |
3 | 34 | 0 | 37 | (-85%) | 115 | (-79%) | 4,255 | (-97%) |
dependency.xml |
11 | 102 | 903 | 1,016 | 3,429 | 3,483,864 | |||
dependency.c2c.xml |
11 | 102 | 0 | 113 | (-89%) | 395 | (-88%) | 44,635 | (-99%) |
dependencyfinder.xml |
27 | 252 | 1,744 | 2,023 | 6,947 | 14,053,781 | |||
dependencyfinder.c2c.xml |
27 | 252 | 0 | 279 | (-86%) | 1,429 | (-79%) | 398,691 | (-97%) |
diff.xml |
9 | 75 | 504 | 588 | 1,580 | 929,040 | |||
diff.c2c.xml |
9 | 75 | 0 | 84 | (-86%) | 235 | (-85%) | 19,740 | (-98%) |
metrics.xml |
13 | 112 | 820 | 945 | 2,873 | 2,714,985 | |||
metrics.c2c.xml |
13 | 112 | 0 | 125 | (-87%) | 418 | (-85%) | 52,250 | (-98%) |
text.xml |
5 | 11 | 20 | 36 | 66 | 2,376 | |||
text.c2c.xml |
5 | 11 | 0 | 16 | (-56%) | 10 | (-85%) | 160 | (-93%) |
all.xml |
35 | 420 | 4,571 | 5,026 | 17,846 | 89,693,996 | |||
all.c2c.xml |
35 | 420 | 0 | 455 | (-91%) | 3,411 | (-81%) | 1,552,005 | (-98%) |
These numbers were taken from version 1.1.0.
Dependencies are not automatically transitive, it depends on the implementation details within the code. Suppose you have:
A --> B --> C
If you make a change in C, you may or may not have to modify A
depending on how A and B are implemented.
A transitive closure is the set of nodes that can be reached by following downstream or upstream dependencies from a starting node. The nodes in this set might be impacted by a change, but they are not automatically. You get the upstream closure by following inbound dependencies. You get the downstream closure by following outbound dependencies. Each string of dependencies forms a path through the graph between two nodes. The number of dependencies that form the path give the path's length. The degree of separation between two nodes is the length of the shortest path between them.
Here is a further example:
A --> B --> C --> D --> E
C is the starting point for the closure. The set of nodes whose
distance to the source is 0 is [C]. The set of nodes whose
distance to the source is 1 is [B, D]. The set of nodes whose
distance to the source is 2 is [A, E].
distance closure 0 [C]1 [B, C, D]no limit [A, B, C, D, E]upstream only [A, B, C]downstream only [C, D, E]
Here is the general algorithm:
A transitive closure only keeps the shortest path between two nodes.
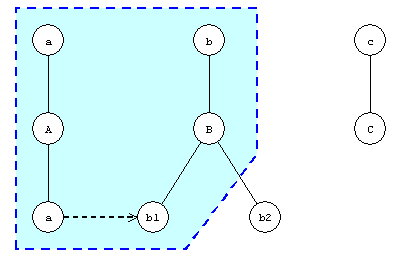
The way Dependency Finder computes a closure is highly sensitive to the data it has to work from. There has to be a path between two nodes in order to include them in the closure.
In the following example, there is no connection between the dependencies
a.A.a --> b.B.b1 and b.B.b2 --> c.C.c. Depending on
how you call Dependency Finder, you may or may not be able to find a closure
emanating from a.A that includes c.C.
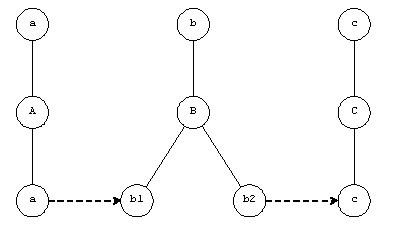
Say you want to find the classes that a.A depends on, both directly and
indirectly. You can compute the closure first and then reduce it to a
class-to-class graph.
    $ DependencyExtractor -xml -out df.xml classes
    $ DependencyClosure -xml -out closureA.xml -start-includes /A/ -stop-includes /C/ df.xml
    $ c2c closureA.xml
    a
        A
            --> b.B
    b
        B
            <-- a.A
What happened was that DependencyClosure followed all dependencies coming from
a.A and its features. It stopped after b.B.b1 because there were no
dependencies leading from it.
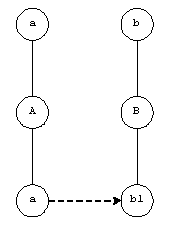
c2c then reduced the closure to it's class-to-class equivalent.
If instead you had reduced the graph first, the result would have ended up different.
    $ DependencyExtractor -xml -out df.xml classes
    $ c2c -xml -out df.c2c.xml df.xml
    $ DependencyClosure -start-includes /A/ -stop-includes /C/ df.c2c.xml
    a
        A
            --> b.B
    b
        B
            <-- a.A
            --> c.C
    c
        C
            <-- b.B
c2c would have removed the fact that the two feature-level dependencies were
not related and DependencyClosure would have been able to follow from a.A to
c.C by going through b.B.
Note that the first closure is still a valid transitive closure for a.A,
since it does not use any of the parts of b.B that require c.C. At
runtime, all that is required for a.A to run properly is b.B. It does not
need to have c.C anywhere on the CLASSPATH.
Sometimes, you want the reverse of a closure. You want everything that is not
used through some starting point such as main(). You need to use a few tools
together to get this negative closure.
Take the following graph for example, we highlighted the transitive closure from
a.A.a. Everything not in the highlighted section is the negative closure.
First, we extract the complete graph and get a list of all the symbols in it.
    $ DependencyExtractor -xml -out df.xml classes
    $ ListFullyQualifiedNames -s:df.xml -o:df.symbols.txt
    a
    a.A
    a.A.a
    b
    b.B
    b.B.b1
    b.B.b2
    c
    c.C
Next, we compute the closure and get a list of the symbols in the closure.
    $ DependencyClosure -xml -out closure.xml -maximum-outbound-depth -start-includes /a.A.a/ df.xml
    $ ListFullyQualifiedNames -s:closure.xml -o:closure.symbols.txt
    a
    a.A
    a.A.a
    b
    b.B
    b.B.b1
Finally, we get the difference between the two lists using ListDiff. The
<removed> tag lists the symbols in the negative closure.
$ ListDiff -out symbols.diff.xml -old df.symbols.txt -new closure.symbols.txt
    <list-diff>
        <name></name>
        <old></old>
        <new></new>
        <removed>
            <line>b.B.b2</line>
            <line>c</line>
            <line>c.C</line>
        </removed>
        <added>
        </added>
    </list-diff>
If you want only the class-to-class negative closure, simply reduce the initial graph and the transitive closure before you extract symbols from them.
So first, process the complete graph.
    $ DependencyExtractor -xml -out df.xml classes
    $ c2c -xml -out df.c2c.xml df.xml
    $ ListFullyQualifiedNames -s:df.c2c.xml -o:df.c2c.symbols.txt
    a
    a.A
    b
    b.B
    c
    c.C
Next, compute the closure.
    $ DependencyClosure -xml -out closure.xml -maximum-outbound-depth -start-includes /a.A.a/ df.xml
    $ c2c -xml -out closure.c2c.xml closure.xml
    $ ListFullyQualifiedNames -s:closure.c2c.xml -o:closure.c2c.symbols.txt
    a
    a.A
    b
    b.B
Finally, we get the difference between the two lists using ListDiff. The
<removed> tag lists the symbols in the negative closure.
$ ListDiff -out c2c.symbols.diff.xml -old df.c2c.symbols.txt -new closure.c2c.symbols.txt
    <list-diff>
        <name></name>
        <old></old>
        <new></new>
        <removed>
            <line>c</line>
            <line>c.C</line>
        </removed>
        <added>
        </added>
    </list-diff>
So at the class level, the negative closure is only class c.C. Even though
feature b.B.b2 is not in the closure, its class, b.B, is part of it and
therefore not in the negative closure.
Many books recommend against circular dependencies between components. Dependency Finder lets you find cycles between packages, classes, or even features. The last two are less useful since tight coupling within a class or within a package is usually desirable, but dependency cycles between packages can be an indicator of circular dependencies between higher-level components.
This is a simple tally of how many dependencies there are in a graph. It
can give you a rough idea of the complexity of a given codebase, but it is
not as powerful as the metrics computed by OOMetrics.
Object-oriented software metrics help assess the quality of a piece of software. You can use them to verify that your architecture evolves in the right direction, from version to version. You can also use them to spot deviations from your quality guidelines, such as methods that have too many parameters or are too long.
Dependency Finder can use the information it extracts from class files to compute software quality metrics. Metrics measure certain aspects of software and provide a quantitative assessment of its quality.
Dependency Finder recognizes four levels of metrics:
Each metrics is composed of a number of measurements. What measurements make
up a given metrics level is defined in a configuration file written in XML.
You can specify a custom configuration file or let the tool use the default
one in ${DEPENDENCYFINDER_HOME}/etc/MetricsConfig.xml.
A set of metrics is a group of measurements pertaining to a given chunk of software. Dependency Finder recognizes four sizes of chunks:
- Project
- These metrics apply to the project as a whole. You can give the name of the project directly to the
OOMetricstools.- Group
- These metrics apply to groups of classes. A Java package is automatically a group, named after the package. You can also define arbitrary groups, using Perl regular expressions. Any class that matches any if the regular expressions will be part of the group. A classes can be part of multiple groups: its package and any number of user-defined groups.
- Class
- These metrics apply to individual classes. They are named with the fully qualified name of the class.
- Method
- These metrics apply to individual methods within a class. They are named after the fully qualified signature of the method. But, some synthetic methods have the same signature as existing methods (e.g., some bridge methods), so we append the return type to the signature to create a unique name. For instance,
java.lang.Class.getName()becomesjava.lang.Class.getName(): java.lang.String
It does not track metrics about class attributes because these are not really all that interesting. The only measurements worth something deal with dependencies, and I rolled those into class metrics.
The configuration file defines what measurements apply to which level of scope (package, group, class, or method). It also defines the rules for creating arbitrary groups. You can customize the content of your metrics report by using different configuration files.
Each measurement has a name and a class that indicates behavior associated with
the measurement. The semantics of each measurement are currently hardcoded in
the MetricsGatherer. It decides which basic values are computed. You can
make minor adjustments by specifying the class used for the measurement. There
are classes for counters, lists, simple mathematical expressions, etc. Each
measurement can be expressed as a numeric value and the configuration file can
define the recommended range for that measurement.
Here is a brief overview of some of the measurements, grouped by chunk. The
definitive list is in ${DEPENDENCYFINDER_HOME}/etc/MetricsConfig.xml.
The following basic measurements are computed for each method.
The following are simple numerical measurements taken against the method.
- Name Character Count (MNCC)
- Number of characters in the method's name.
- Name Word Count (MNWC)
- Number of words that make up the method's name.
- Parameters (PARAM)
- Number of parameters for the method. Very long signatures are often seen as a sign of poor design.
- Single Line of Code (SLOC)
- Number of code lines in the method. Comments and empty lines are not counted. Large methods are usually a sign of poor design.
- Local Variables (LVAR)
- Number of local variables use by the method.
The following measurements list classes, methods, and fields that have a dependency to or from this method.
- Inbound Intra-Class Method Dependencies (IICM)
- Other methods within the same class, that depend on this method.
- Outbound Intra-Class Feature Dependencies (OICF)
- Methods and fields within the same class that this method depends on.
- Inbound Intra-Package Method Dependencies (IIPM)
- Methods in other classes of the same package that depend on this method.
- Outbound Intra-Package Feature Dependencies (OIPF)
- Methods and fields within the classes of the same package that this method depends on.
- Inbound Extra-Package Method Dependencies (IEPM)
- Methods in other packages that depend on this method.
- Outbound Extra-Package Feature Dependencies(OEPF)
- Methods and fields in other packages that this method depends on.
- Outbound Intra-Package Class Dependencies (OIPC)
- Classes within the same package that this method depends on.
- Outbound Extra-Package Class Dependencies (OEPC)
- Classes in other packages that this method depends on.
The following basic measurements are computed for each class.
The following are simple numerical measurements taken against the class.
- Name Character Count (CNCC)
- Number of characters in the class's name.
- Name Word Count (CNWC)
- Number of words that make up the class's name.
- Major Version Number (MaV)
- The major version number of the
.classfile, set by the compiler, and tells which version of the virtual machine can execute it.- Single Line of Code (SLOC)
- Number of code lines in the class. Comments and empty lines are not counted. Large classes are usually a sign of poor design.
- Subclasses (SUB)
- Number of direct subclasses of this class.
- Depth of Inheritance (DOI)
- How many hops there are between the top of the inheritance hierarchy and this class.
- Attributes (A)
- Number of attributes in this class.
- Methods (M)
- Number of methods in this class
- Inner Classes (IC)
- Number of inner classes in this class.
The following measurements list classes, methods, and fields that have a dependency to or from this method.
- Inbound Intra-Package Dependencies (IIP)
- Classes of the same package that depend on this class.
- Inbound Extra-Package Dependencies (IEP)
- Classes in other packages that depend on this class.
- Outbound Intra-Package Dependencies (OIP)
- Classes of the same package that this class depends on.
- Outbound Extra-Package Dependencies (OEP)
- Classes of other packages that this class depends on.
- Inbound Intra-Package Method Dependencies(IIPM)
- Methods and fields in other classes of the same package that depend on this class.
- Inbound Extra-Package Method Dependencies (IEPM)
- Methods in other packages that depend on this class.
The following basic measurements are computed for each group. They are simple numerical measurements taken against the group.
Each package is automatically a group. The configuration file can also define additional arbitrary groups that will be collected in addition to package-related groups.
- Name Character Count (GNCC)
- Number of characters in the group's name.
- Name Word Count (GNWC)
- Number of words that make up the group's name.
- Classes (C)
- Number of classes in this group.
- Interfaces (I)
- Number of interfaces in this group
The following basic measurements are computed for the whole project. They are simple numerical measurements taken against the project.
- Groups (G)
- Number of groups in the project.
- Packages (P)
- Number of packages in the project
All the dependency-related measurements can accumulate the explicit
dependencies that make them. All you need to do is make their class
com.jeantessier.metrics.NameListMeasurement in the configuration file. You
can list those dependencies as part of your report by giving the -expand
switch to OOMetrics.
The current types of measurement are as follow:
ContextAccumulatorMeasurement- Aggregates lists from other measurements in the same context. It uses Perl regular expressions to filter list elements.
CounterMeasurement- A simple counter, it tallies the values that are put in it. If you try to add a non-number, it simply adds 1.
NameListMeasurement- Accumulates a set of values. Its numerical value is the cardinality (i.e., size) of the set.
OOMetricsuses it to keep track of dependencies.NbSubMetricsMeasurement- Counts how many submetrics there are in the measurement's context. It can use selection criteria while counting. These are akin to "WHERE C > 10".
RatioMeasurement- Divides one measurement (base) by another (divider). Both must be in the same context.
SingleValueMeasurement- A simple value holder, it stores the latest value that was put in it. If you try to add a non-number, it does nothing.
StatisticalMeasurement- Computes the statistical properties of a given measurement across the submetrics of the measurement's context. Given a measurement name, it explores the tree of metrics rooted at the context and finds the numerical value of these named measurements in the tree. For these measurements, it computes:
- minimum value
- median value
- average value
- standard deviation
- maximum value
- sum
- number of data points
A quick note regarding the median value. If the number of data points is odd, we can sort them and return the single value in the middle. For the dataset
[1, 2, 3, 4, 5], the median is3. But if the number of data points is even, there is no single value in the middle. Instead, we return the average of the two values in the middle of the sorted dataset. For the dataset[1, 2, 3, 4, 5, 6], the median is the average of3and4, so the median value is3.5. This matches the definition of median on Wikipedia.You can also pull specific percentile values by specifying them as part of the configuration.
p50is akin to he median.p100is the maximum value.SubMetricsAccumulatorMeasurement- Aggregates lists from measurements in submetrics of the current context. It uses Perl regular expressions to filter list elements.
SumMeasurement- Adds up numerical values. Use it with just one term to alias other measurements.
Whenever a measurement references another measurement, there is a chance
that that measurement is itself a StatisticalMeasurement standing in
for a collection of others at the lower levels. The measurement making
the reference can specify explicitly which subvalue (i.e., minimum, median,
etc.) of the StatisticalMeasurement it wants to use for its own
computation. Or, it can rely on the StatisticalMeasurement's self
disposition setting. A StatisticalMeasurement can specify explicitly
which of its subvalues it wants to use for its numerical value. By
default, it uses the average value.
These measurements can potentially refer to other measurements and make use of
the disposition feature when dealing with StatisticalMeasurement:
ContextAccumulatorMeasurementNbSubMetricsMeasurementRatioMeasurementStatisticalMeasurementSubMetricsAccumulatorMeasurementSumMeasurementRight now, measurement processing is fixed. In the future, you will be able to define your own types of measurements and plug them into the framework.
OOMetrics and OOMetricsGUI create one project-level metrics for the
whole project. This level has measurements that span the entire analyzed
codebase. For each .class file, they create one class-level metrics for
that class, and one method-level metrics for each of its methods.
The tools add class-level metrics to relevant group-level metrics. One such group, which the tools create automatically for each class, is named after the package that this class belongs to. You can define additional groups in the configuration file by providing a name for the group and one or more Perl regular expressions. If the class name matches any of the regular expressions, the class will be added to that group. This allows you to group together classes for a component or module that might span multiple Java packages.
    <group-definitions>
        <group-definition>
            <name>Servlet API</name>
            <pattern>/^javax.servlet/</pattern>
        </group-definition>
        <group-definition>
            <name>Test</name>
            <pattern>/test/i</pattern>
        </group-definition>
    </group-definitions>
You use OOMetrics and OOMetricsGUI to extract .class files and
compute metrics. The list of metrics is taken from a configuration file
written in XML. You set the file with the -configuration switch to
either command. There is also a -default-configuration switch that
kicks if you do not provide a -configuration switch. This is how the
launching scripts can point to the standard configuration in
${DEPENDENCYFINDER_HOME}/etc/MetricsConfig.xml even if you don't
specify a configuration on the command-line.
There are two configurations that come bundled with Dependency Finder.
${DEPENDENCYFINDER_HOME}/etc/MetricsConfig.xml- It has a series of measurements and statistical compilations at various levels. It can assist you in evaluating the size and complexity of your software. You can use it to find large classes or methods, or to find pieces with a disproportionate number of dependencies.
${DEPENDENCYFINDER_HOME}/etc/MartinConfig.xml- Computes
I,A, andD', as per Robert C. Martin's article.
You can start from these to define your own configurations where you adjust the output to the metrics you care about.
If you don't need a given measurement, put visible="no" in its
<measurement> tag. You could remove the tag altogether, but other
measurements might depend on it. They would compute faulty values it
you were to remove it, whereas marking it invisible will only remove
it from the final output.
You can add new measurements that are functions of ones that already exist.
AccumulatorMeasurement- For merging and filtering name lists
RatioMeasurement- For comparing values to one another
StatisticalMeasurement- Get distribution information for another measurement
SumMeasurement- Add measurements together or provide aliases to existing ones
Look at ${DEPENDENCYFINDER_HOME}/etc/MartinConfig.xml for an exemple
of how you can combine these types of measurements to compute complex
values.
You can also add your own group definitions to report on related
classes that might not all be in the same Java package. For example,
all classes with "Test" in the name, or all classes under a given
top-level package, such as javax.servlet.
You can customize the valid range of measurements to the particular
conditions of your project. Each <measurement> tag can
contain optional <lower-threshold> and <upper-threshold>
tags. Reports can highlight measurement values that fall outside
of the valid range you specified.
specify valid range is none all values are valid lower threshold only all values greater than or equal to the threshold are valid upper threshold only all values lesser than or equal to the threshold are valid both lower and upper threshold only all values in the range between the lower and upper threshold, including them, are valid
Note that if all these ranges include the threshold themselves. If a value is equal to either the lower or the upper threshold, it is still considered valid. Also, if the upper threshold is less than the lower threshold, then no value will ever be considered valid. At this time, you cannot specify an exclusive range, where a measurement would be valid unless it fell within the designated range.
A future version of Dependency Finder will let you write custom measurement classes so you can compute your own metrics. Right now, the basic set is hard-coded and the configuration allows you mainly to customize the report.
Statistical measurements can print out as:
self_dispose [minimum median/average standard_deviation maximum sum (size_of_data_set)]
The first value is the numeric value of the measurement. Which one of the
values this is depends on the self disposition used in the measurement's
<init> tag. By default, it is the average of the data set.
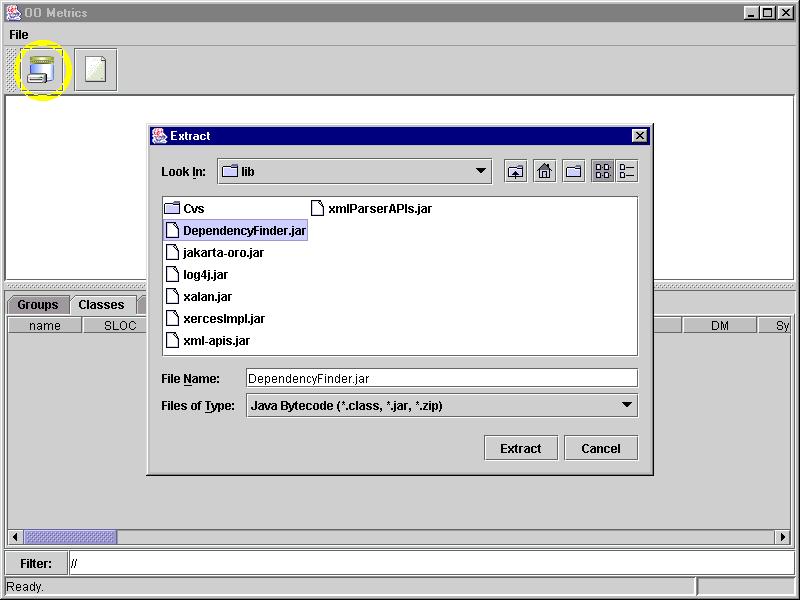
Select File | Extract; this will popup a file dialog.
Select the files and/or directories to extract from and click Extract.
You can repeat this command as often as needed; each time, the extracted
metrics will be added to the current set of metrics in memory.
You can limit the number of rows on display with the filtering mechanism at
the bottom of the user interface. You enter a Perl regular expression in
the text field and click the button marked Filter:.
You can sort entries by the value of any measurement by clicking on the
header of each column. Each mouse click alternates between ascending
and descending sorting order. This also works for the name column.
You use OOMetrics to compute metrics and produce a report. Simply string
out the files and directories on the command-line. The content of the report
depends on the switches on the command-line.
    $ OOMetrics -txt
                classes
                ${JAVA_HOME}/JRE/lib/rt.jar
You can use the following switches to determine which levels of metrics are included in the report. You can combine them if you want to. If you do not specify any level, the default is to include all of them.
-project- Include project-related metrics.
-groups- Include group- and package-related metrics.
-classes- Include class-related metrics.
-methods- Include method-related metrics.
You must specify an output mode with one of these switches.
-csv- Writes each requested section in its own CSV file, perfect for loading in Google Docs or Microsoft Excel, and for charting.
-json- Writes a single JSON report with all the requested sections.
-text-txt- Writes a single text report with all the requested sections.
-xml- Writes a single XML report with all the requested sections.
-yaml-yml- Writes a single YAML report with all the requested sections.
You can specify an output file with the -out switch. For text, JSON, XML,
and YAML output, it writes a single file with the total report. For CSV
output, however, the -out switch provides a prefix and OOMetrics will
write one file per selected level and append either "_project.csv",
"_groups.csv", "_classes.csv", or "_methods.csv", according to the
level.
    $ OOMetrics -out df.txt
                -txt
                ${DEPENDENCYFINDER_HOME}/lib/DependencyFinder.jar
You use the com.jeantessier.dependencyfinder.ant.OOMetrics task to compute
metrics and produce a report. You need to associate the class to a tag using
Ant's <taskdef> task. You also need to tell Ant where to find the
Dependency Finder classes. There is a special
help page on how to do this.
You can specify an output file with the destprefix attribute. Here, the
attribute only provides a prefix for the output files. OOMetrics will
add the appropriate suffix, depending on the output mode. For text, JSON, XML,
and YAML output, it writes only one file with the total report. For CSV output,
however, it writes one file per selected section; each filename starts
with the prefix you specify, followed by either "_project.csv",
"_groups.csv", "_classes.csv", or "_methods.csv", according to the
level.
    <oometrics allmetrics="yes"
               txt="yes"
               configuration="${dependencyfinder.home}/etc/MetricsConfig.xml"
               destprefix="metrics">
        <path>
            <pathelement location="."/>
        </path>
    </oometrics>
Either you write software that is used by other programmers to build their own
software, or you write software for non-programmers to use as is. Sometimes,
you are your own customer, but that is still in a programmer or non-programmer
capacity. In all cases, you want to use JarJarDiff to keep track of changes
in your API, either for your own sanity or that of others.
If you are developing libraries or frameworks, that is, software that will be
used and/or extended by other programmers, you need to know what changed from
version to version. Your clients depend on your published set of APIs for
their own development efforts. It becomes important, as you release new
revisions of your software, to keep track of which parts of the published API
changed, so that you can tell your clients how to upgrade their code.
JarJarDiff can compute differences automatically, so you can quickly know
what you might have broken in your customer's code. Maybe you can even just
hand them the report from JarJarDiff.
If you are developing end-user applications, it is still a good practive to have a look at what changed across your software between baselines. It lets you keep track of changes to the classes and methods and verify that they are evolving in the right direction, whichever way that is for you. Keeping your software evolution under control frees you up to focus on developing the features your clients want, instead of fighting your own code to wedge in new functionality.
You can use JarJarDiff straight from the command-line or you can make it an
integral part of your build through its Ant integration. I will address each
one in turn.
In the following discussion, I will use the following notation to distinguish between things you have to provide, what comes with the JDK, and what Dependency Finder gives you.
 |
Source files that you write. |
 |
JDK tools and the files they generate. |
 |
Dependency Finder tools and files they generate, based on your code. |
Typically, you compile Java source files to .class files and javadocs.
You may even combine the .class files into one or more JAR files. From
source code in .java files, you can use javadoc to generate HTML
documentation or you can use javac/jar to generate executable code in JAR
files.
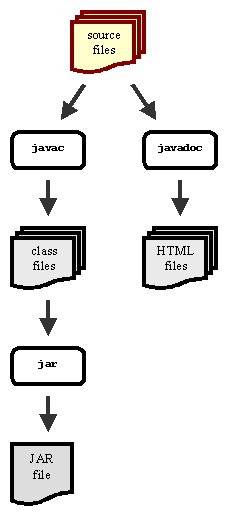
The tools in Dependency Finder work from the compiled code, either in JAR files
or in individual .class files; they do not work from either the source code
or the generated javadoc.
You use JarJarDiff to extract API differences. The following command
computes the API differences between versions Old and New of My Project.
The differences are saved as an XML document in the file diff.xml.
    $ JarJarDiff -out diff.xml
                 -name "My Project"
                 -old-label Old
                 -old old.jar
                 -new-label New
                 -new new.jar
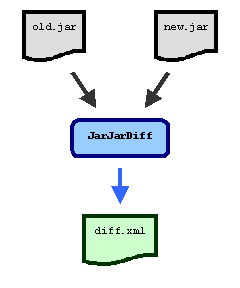
You use -old switches to tell it where the old, or base, version is
located. You can use multiple -old switches if it is spread across multiple
locations. If an -old switch points to a directory, it will be searched for
possible compiled Java code. This means JarJarDiff will include any JAR,
EAR, WAR, or Zip files it encounters in that directory or any of its
subdirectories, in addition to any .class files it encounters. You can
include a label for the version with the -old-label switch. If you do not
provide a label, the tool will create one by for you by concatenating the
values of the -old switches. In the example above, it would have created the
label old.jar if we had not given it one already.
You use -new switches to tell it where the new, or modified, version is
located. You can use multiple -new switches if it is spread across multiple
locations. If an -new switch points to a directory, it will be searched for
possible compiled Java code. This means JarJarDiff will include any JAR,
EAR, WAR, or Zip files it encounters in that directory or any of its
subdirectories, in addition to any .class files it encounters. You can
include a label for the version with the -new-label switch. If you do not
provide a label, the tool will create one for you by concatenating the
values of the -new switches. In the example above, it would have created the
label new.jar if we had not given it one already.
By default, the raw results are written in XML to the standard output stream
(i.e., System.out). You can have it write to a file by using the -out
switch.
You can also do the extraction from your build script if you use Ant. The
special task <JarJarDiff> computes differences and writes a report.
You need to tell Ant where to find Dependency Finder, there is a special
help page detailing how to do this.
    <jarjardiff destfile="diff.xml"
                name="My Project"
                oldlabel="Old"
                newlabel="New">
        <old>
            <pathelement location="old.jar"/>
        </old>
        <new>
            <pathelement location="new.jar"/>
        </new>
    </jarjardiff>
    <xslt style="${dependencyfinder.home}/etc/PublishedDiffToHTML.xsl"
          in="diff.xml"
          out="diff.html"/>
Dependency Finder includes XSL stylesheets for representing differences using HTML.
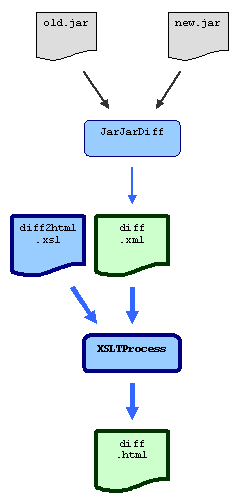
There are two stylesheets:
DiffToHTML.xslListInheritanceDiffToText.xsl
DiffToHTML simply renders the whole report as HTML.
ListInheritanceDiffToText only shows changes in the inheritance hierarchy.
You can run them using the scripts of the same names and their -in and -out
switches. The scripts call Saxon and specify the XSL stylesheet with
the -xsl switch. You can convert the reports yourself, if you want to,
either with Dependency Finder's stylesheets or any others that understand the
internal structure of the reports. See the Developer Guide
for more details on writing your own stylesheets.
Various switches impact what JarJarDiff includes in the report and what it
leaves out.
By default, JarJarDiff only reports API changes, that is, changes in the
definition of programming elements. It does not report on changes in their
implementation.
You can use the -code switch to tell it to also flag methods with a different
implementation or constants with a different value. This is regardless of
whether their definition has changed. A method could have exactly the same
declaration but some change in its implementation and it will be included in
the report.
    $ JarJarDiff -code
                 -old old.jar
                 -new new.jar
                 -out codediff.xml
    $ DiffToHTML -s:codediff.xml
                 -o:codediff.html
You can control what kind of changes are in the report with the -level
switch.
By default, JarJarDiff lists all API differences, whether they are on public
or private elements, or anything in between. These reports can be quite
lengthy and include internal details of your API. They are useful for internal
use, monitoring the evolution of the codebase, but not all that useful to
third parties.
The following commands produce a full report from the output of JarJarDiff.
Note that -level api is the default, so technically, you don't need to
specify it. I include it here so you can better compare with the other
options.
    $ JarJarDiff -level api
                 -old old.jar
                 -new new.jar
                 -out fulldiff.xml
    $ DiffToHTML -s:fulldiff.xml
                 -o:fulldiff.html
You can limit the report to changes that would break backwards compatibility
of your code. In this mode, JarJarDiff limits itself to public and protected
members of public classes and it does not report changes that would not break
client code. It does not need to report on private or package-level members
because client code should not refer to it to begin with. The same goes for
package-level classes.
It will report a method that went from non-final to final because that would potentially break subclasses that tried to override that method. But it will not report a method that went from final to non-final since that couldn't possibly break client code: subclasses would not have been able to override it since it was marked final.
Similarly, JarJarDiff will report on removed members and classes, but not on
new ones. See the javadocs for
com.jeantessier.diff.IncompatibleDifferenceStrategy for a complete list of
what's in the report and what is not.
The following commands produce a full report from the output of JarJarDiff.
This time, the switch -level incompatible is no longer optional.
    $ JarJarDiff -level incompatible
                 -old old.jar
                 -new new.jar
                 -out incompatdiff.xml
    $ DiffToHTML -s:incompatdiff.xml
                 -o:incompatdiff.html
You can customize the report by providing the name of your own implementation
of the com.jeantessier.diff.DifferenceStrategy interface as the value to the
-level switch. See the Developer Guide for the details
of implementing this interface.
    $ JarJarDiff -level com.acme.MyCustomDifferenceStrategy
                 -old old.jar
                 -new new.jar
                 -out customdiff.xml
    $ DiffToHTML -s:customdiff.xml
                 -o:customdiff.html
Your custom class will need to be somewhere on your CLASSPATH in order for
JarJarDiff to find it.
You can limit the reports to an explicit list of symbols. Simply list the
fully-qualified targets, one per line, in a simple text file and pass it to
JarJarDiff.
    $ JarJarDiff -filter filter.txt
                 -old old.jar
                 -new new.jar
                 -out filterdiff.xml
    $ DiffToHTML -s:filterdiff.xml
                 -o:filterdiff.html
Dependency Finder used to include a Java Doclet that could use Javadoc annotations to tease out the published interface of a codebase. Doclets were removed in Java 9, so this functionality is not available anymore.
Here are some use cases that are more elaborate. They combine functionality from multiple tools.
This use case deals with having a large codebase and tracking usage of
deprecated classes and methods. As your codebase grows and your third-party
libraries get updated, it is inevitable that it will end up using deprecated
APIs. javac can list violations, but only up to the first 100 and the output
is a simple flat list of violations.
Dependency Finder can track all uses of deprecated APIs and group them by
various criteria. You can use either DependencyReporter or OOMetrics,
depending on how you want to structure the results.
But regardless of which way you go about it, you must first list the deprecated
symbols you are looking for. Run ListDeprecatedElements on all the JARs that
might contain deprecated symbols. Don't forget to include rt.jar. Save the
output to a file that will list each deprecated element, one per line.
    $ ListDeprecatedElements -out deprecated.txt
                             ${JAVA_HOME}/jre/lib/rt.jar
                             lib
                             classes
Note: This may take a while.
You only need to run this command when a JAR changes. In the example above,
we look at third-party libraries in lib and the project's own codebase in
classes. The codebase is likely to change very often, but you don't have to
wait for the tool to analyze large libraries, such as rt.jar, every time.
You can split the call and generate two lists: one list for all third-party
libraries (fairly stable, doesn't change often) and one list for our own
codebase (generate new list with every build to take into account the latest
changes).
    $ ListDeprecatedElements -out deprecated.libs.txt
                             ${JAVA_HOME}/jre/lib/rt.jar
                             lib
    $ ListDeprecatedElements -out deprecated.code.txt
                             classes
The examples in this section use the CLI, but there are equivalent Ant tasks so you can put this in your nightly build very easily.
Let's use the following simple class as an example to illustrate the various reports. It has one deprecated method and another method calling it, therefore creating a dependency on a deprecated symbol.
    public class DeprecatedExample {
        /**
         * @deprecated
         */
        public void deprecatedMethod() {}
        public void callingMethod() {
            deprecatedMethod();
        }
    }
You can extract a list of deprecated symbols from it.
$ ListDeprecatedElements -out deprecated.txt DeprecatedExample.class
DeprecatedExample.deprecatedMethod()
Now that you have a list of deprecated symbols, you can analyze the codebase to determine where they are being used. You can use either with a dependency graph or with dependency-related metrics.
Generate a dependency graph to work from:
$ DependencyExtractor -xml -out graph.xml DeprecatedExample.class
        DeprecatedExample
            --> java.lang.Object
            DeprecatedExample()
                --> java.lang.Object.Object()
            callingMethod()
                --> DeprecatedExample.deprecatedMethod()
            deprecatedMethod()
                <-- DeprecatedExample.callingMethod()
    java.lang
        Object
            <-- DeprecatedExample
            Object()
                <-- DeprecatedExample.DeprecatedExample()
Then, run the DependencyReporter to show dependencies related to the
deprecated API. The tool can either group them by deprecated element, showing
where they are called, or by caller, showing which deprecated element they
call.
It is useful to organize the report by deprecated element to find all the
places where a given deprecated symbol is referenced. In the example, it will
show where deprecatedMethod() is called from.
For a text report organized by deprecated element:
    $ DependencyReporter -out report.txt
                         -show-inbounds
                         -scope-includes-list deprecated.txt
                         graph.xml
        DeprecatedExample
            deprecatedMethod()
                <-- DeprecatedExample.callingMethod()
For an HTML report organized by deprecated element:
    $ DependencyReporter -xml -out report.xml
                         -show-inbounds
                         -scope-includes-list deprecated.txt
                         graph.xml
$ DependencyGraphToHTML -s:report.xml -o:report.html
It is useful to organize the report by caller to find all usage of deprecated
symbols in a given section of your codebase. In the example, it will show what
deprecated methods are used by callingMethod().
For a text report organized by caller:
    $ DependencyReporter -out report.txt
                         -show-outbounds
                         -filter-includes-list deprecated.txt
                         graph.xml
        DeprecatedExample
            callingMethod()
                --> DeprecatedExample.deprecatedMethod()
For an HTML report organized by caller:
    $ DependencyReporter -xml -out report.xml
                         -show-outbounds
                         -filter-includes-list deprecated.txt
                         graph.xml
$ DependencyGraphToHTML -s:report.xml -o:report.html
You can use multiple -scope-includes-list and -filter-includes-list
switches if your deprecated API list consists of more than one file.
    $ DependencyReporter -out report.txt
                         -show-inbounds
                         -scope-includes-list deprecated.libs.txt
                         -scope-includes-list deprecated.code.txt
                         graph.xml
    $ DependencyReporter -out report.txt
                         -show-outbounds
                         -filter-includes-list deprecated.libs.txt
                         -filter-includes-list deprecated.code.txt
                         graph.xml
DependencyReporter can also take -scope-excludes-list and
-filter-excludes-list switches for deprecated items that you may want to skip
over. There are times when reliance on a deprecated API is inevitable or too
expensive to correct. Yet, you don't want it to appear again and again in
reports and distract from other use of deprecated material that needs to be
fixed. You can keep track manually of the cases to ignore. When you pass them
to DependencyReporter, it will be remove them from the includes list.
    $ DependencyReporter -out report.txt
                         -show-inbounds
                         -scope-includes-list deprecated.libs.txt
                         -scope-includes-list deprecated.code.txt
                         -scope-excludes-list deprecated.skip.txt
                         graph.xml
DependencyReporter provides a simple format where a lot of data is presented
succinctly side-by-side. But you may want to group this data in larger chunks.
For this, you can use OOMetrics instead.
You can use OOMetrics to write either an HTML report or one of two text
report formats.
To generate reports organized by deprecated elements, use the configuration
file in etc/InboundDependencyConfig.xml.
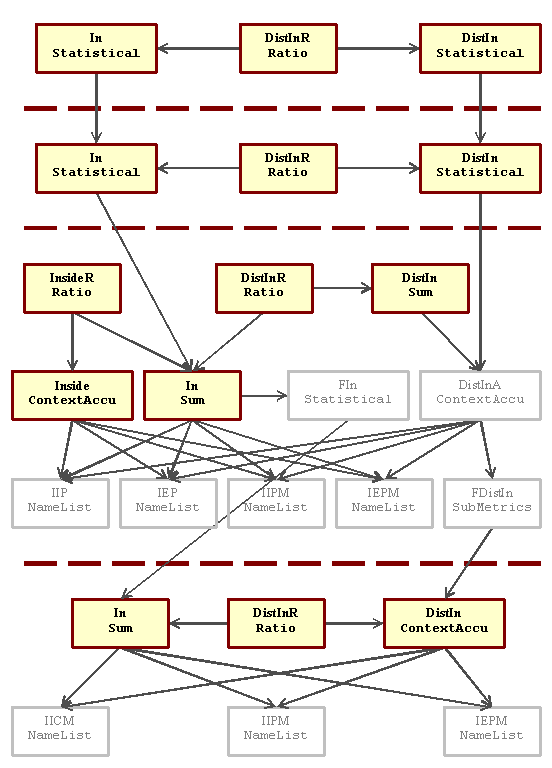
In counts all calls, including duplicates. DistIn removes duplicates and
can list its entries when OOMetrics is used with -expand. At project
level, they account for the whole project. At group level, they account for an
entire group or package. At the class level, they account for a single class.
At the method, they account for an individual method. Inside is used to show
dependencies on the class itself that do not come from its methods.
For a text report organized by deprecated elements, with all methods listed together:
    $ OOMetrics -out report
                -configuration ${DEPENDENCYFINDER_HOME}/etc/InboundDependencyConfig.xml
                -filter-includes-list deprecated.txt
                -txt
                -expand
                DeprecatedExample.class
    Project metrics
    ---------------
    Project
        Used by APIs (In): 1 [1 1/1 0 1 1 (1)]
        Used by distinct APIs (DistIn): 1 (100%) [1 1/1 0 1 1 (1)]
    Group metrics
    -------------
        Used by APIs (In): 1 [1 1/1 0 1 1 (1)]
        Used by distinct APIs (DistIn): 1 (100%) [1 1/1 0 1 1 (1)]
    Class metrics
    -------------
    DeprecatedExample
        Used by APIs (In): 1
        Used by distinct APIs (DistIn): 1 (100%)
        Used by additional APIs directly (Inside): 0 (0%)
    Method metrics
    --------------
    DeprecatedExample.deprecatedMethod()
        Used by APIs (In): 1
        Used by distinct APIs (DistIn): 1 (100%)
            DeprecatedExample.callingMethod()
For a text report organized by deprecated element, with methods grouped by class:
    $ OOMetrics -out report
                -configuration ${DEPENDENCYFINDER_HOME}/etc/InboundDependencyConfig.xml
                -filter-includes-list deprecated.txt
                -xml
                -expand
                DeprecatedExample.class
$ MetricsToText -s:report.xml -o:report.txt
    Project
        Used by APIs: 1.0 [1.0, 1.0, 1.0, 0.0, 1.0, 1.0, 1]
        Used by distinct APIs: 1.0 [1.0, 1.0, 1.0, 0.0, 1.0, 1.0, 1]
        Used by distinct APIs ratio: 1.0
            Used by APIs: 1.0 [1.0, 1.0, 1.0, 0.0, 1.0, 1.0, 1]
            Used by distinct APIs: 1.0 [1.0, 1.0, 1.0, 0.0, 1.0, 1.0, 1]
            Used by distinct APIs ratio: 1.0
            DeprecatedExample
                Used by APIs: 1.0
                Used by distinct APIs: 1.0
                Used by distinct APIs ratio: 1.0
                Used by additional APIs directly: 0
                Used by additional APIs directly ratio: 0.0
                DeprecatedExample.deprecatedMethod()
                    Used by APIs: 1.0
                    Used by distinct APIs: 1
                        DeprecatedExample.callingMethod()
                    Used by distinct APIs ratio: 1.0
For an HTML version of this report, use MetricsToHTML instead in the final
step.
To generate reports organized by caller, use the configuration file in
etc/OutboundDependencyConfig.xml.
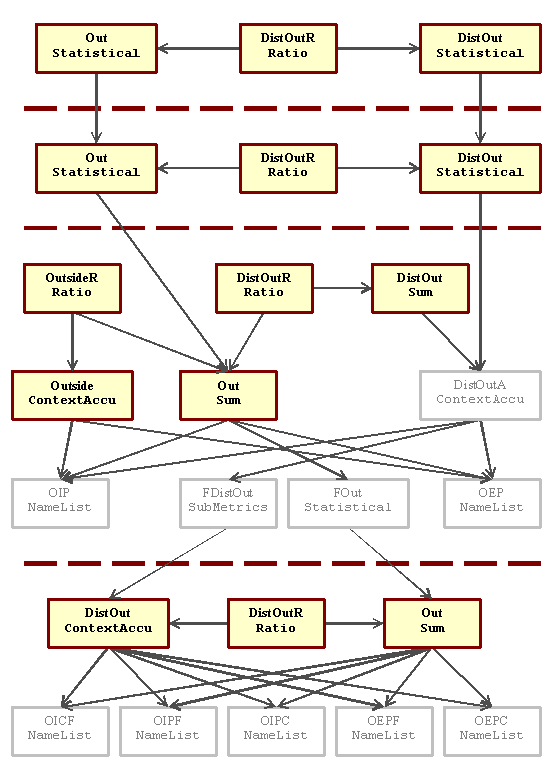
Out counts all calls, including duplicates. DistOut removes duplicates and
can list its entries when OOMetrics is used with -expand. At project
level, they account for the whole project. At group level, they account for an
entire group or package. At the class level, they account for a single class.
At the method, they account for an individual method. Outside is used to
show dependencies from the class itself that do not go through its methods.
For a text report organized by caller, with all methods listed together:
    $ OOMetrics -out report
                -configuration ${DEPENDENCYFINDER_HOME}/etc/OutboundDependencyConfig.xml
                -filter-includes-list deprecated.txt
                -txt
                -expand
                DeprecatedExample.class
    Project metrics
    ---------------
    Project
        Uses APIs (Out): 1 [1 1/1 0 1 1 (1)]
        Uses distinct APIs (DistOut): 1 (100%) [1 1/1 0 1 1 (1)]
    Group metrics
    -------------
        Uses APIs (Out): 1 [1 1/1 0 1 1 (1)]
        Uses distinct APIs (DistOut): 1 (100%) [1 1/1 0 1 1 (1)]
    Class metrics
    -------------
    DeprecatedExample
        Uses APIs (Out): 1
        Uses distinct APIs (DistOut): 1 (100%)
        Uses additional APIs in fields and class structure (outside of methods) (Outside): 0 (0%)
    Method metrics
    --------------
    DeprecatedExample.callingMethod()
        Uses APIs (Out): 1
        Uses distinct APIs (DistOut): 1 (100%)
            DeprecatedExample.deprecatedMethod()
For a text report organized by caller, with methods grouped by class:
    $ OOMetrics -out report
                -configuration ${DEPENDENCYFINDER_HOME}/etc/OutboundDependencyConfig.xml
                -filter-includes-list deprecated.txt
                -xml
                -expand
                DeprecatedExample.class
$ MetricsToText -s:report.xml -o:report.txt
    Project
        Uses APIs: 1.0 [1.0, 1.0, 1.0, 0.0, 1.0, 1.0, 1]
        Uses distinct APIs: 1.0 [1.0, 1.0, 1.0, 0.0, 1.0, 1.0, 1]
        Uses distinct APIs ratio: 1.0
            Uses APIs: 1.0 [1.0, 1.0, 1.0, 0.0, 1.0, 1.0, 1]
            Uses distinct APIs: 1.0 [1.0, 1.0, 1.0, 0.0, 1.0, 1.0, 1]
            Uses distinct APIs ratio: 1.0
            DeprecatedExample
                Uses APIs: 1.0
                Uses distinct APIs: 1.0
                Uses distinct APIs ratio: 1.0
                Uses additional APIs in fields and class structure (outside of methods): 0
                Uses additional APIs in fields and class structure (outside of methods) ratio: 0.0
                DeprecatedExample.callingMethod()
                    Uses APIs: 1.0
                    Uses distinct APIs: 1
                        DeprecatedExample.deprecatedMethod()
                    Uses distinct APIs ratio: 1.0
For an HTML version of this report, use MetricsToHTML instead in the final
step.
You often rely on third-party libraries for specific functions in your own software. For example, Dependency Finder uses Log4J for logging and Jakarta-ORO for matching regular expressions. When these third-party libraries release new versions, you need to figure out the impact that upgrading to the newer version will have on your code.
This is where JarJarDiff can help. But it reports all changes, many of
which may be internal only or in areas that you are not using. You can run the
output through PublishedDiffToHTML to limit it to externally visible elements
(public and protected), but that may not be enough. The third-party library
provider may not give you a list of their published API to further restrict
PublishedDiffToHTML, but you can build your own using Dependency Finder,
customized to your own usage of the library.
For example, say software S depends on library L and there is a new version L' of the library now available. What will be the impact on S? L can comprise many JAR files and many packages with no obvious root.
Step 1: Get a list of all the symbols in L. You will use a dependency graph later to narrow this list down to the symbols that S actually uses.
    $ ListSymbols -txt -out L.symbols.txt
                  -classes
                  -methods
                  -fields
                  L
Step 2: Build a dependency graph from S.
    $ DependencyExtractor -xml -out S.graph.xml
                          S
Step 3: Get a subgraph from the symbols from L.
    $ DependencyReporter -xml -out S-L.graph.xml
                         -show-empty-nodes
                         -scope-includes-list L.symbols.txt
                         S.graph.xml
    $ DependencyGraphToText -s:S-L.graph.xml
                            -o:S-L.symbols.txt
If you use multiple third-party libraries, you don't have to to repeat all
these steps for each one of them. You can either extract symbols from all of
them in one call or supply multiple -scope-includes-list switches to
DependencyReporter. Either way, in the end, you will get a single text file
that has all the symbols across all third-party libraries.
Now, S-L.symbols.txt has the list of all elements from L used in S.
You can pass it to JarJarDiff to limit the report to these elements only.
Step 4: Get the differences between L and L', narrowed down the differences to what is used by S.
    $ JarJarDiff -filter S-L.symbols.txt
                 -name L
                 -old-label L
                 -old L
                 -new-label L'
                 -new L'
                 -out L-L'.diff.xml
Step 5: Convert to HTML
    $ DiffToHTML -s:L-L'.diff.xml
                 -o:L-L'.diff.html
The level of detail in the final report depends on which what parameters you
use with JarJarDiff. This example focuses exclusively on those parts of the
L that you are actually using in S.
You can use OOMetrics to compute Robert C. Martin's D metric. Dependency
Finder comes with a special configuration that computes a normalized variation,
called D', in the configuration file etc/MartinConfig.xml.
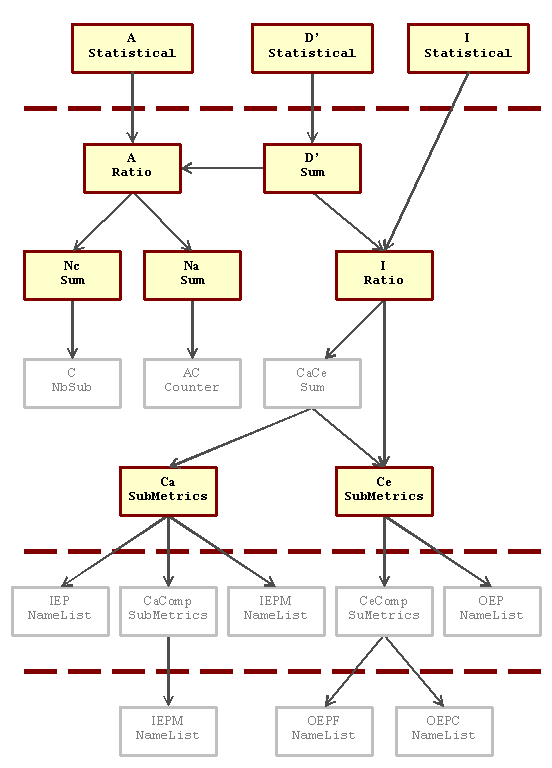
D, A, and I work at the group or package level.
The formula for I is:
I = Ce / (Ca + Ce)
Ca is the number of classes outside this package that depend on classes
inside this package (i.e., inbound dependencies). Ce is the number of
classes outside this package that classes in the package depend on (i.e.,
outbound dependencies). Feature names are converted to class names with Perl
regular expressions. All class names are collected with
SubMetricsAccumulatorMeasurement to remove duplicates. With Ca and Ce,
the tool can calculate the value of I for the package.
The formula for A is:
A = Na / Nc
OOMetrics already computes C and AC that correspond to Nc and Na
respectively. The configuration uses SumMeasurement to give them aliases to
relate them to the computation of A.
The formula for D' is:
D' = A + I - 1
It is computed for each group. At the project level, the configuration gives a
statistical analysis of D', A, and I across the project's codebase.
For a text report straight from the tool:
    $ OOMetrics -out report
                -configuration ${DEPENDENCYFINDER_HOME}/etc/MartinConfig.xml
                -txt
                classes
For a text report from the XML output:
    $ OOMetrics -out report
                -configuration ${DEPENDENCYFINDER_HOME}/etc/MartinConfig.xml
                -xml
                classes
$ MetricsToText -s:report.xml -o:report.txt
For an HTML version of this report, use MetricsToHTML instead in the last
step.
Look at the current bug list on GitHub. There is also a help-oriented discussion forum.
You can also email me at jeantessier at users.sourceforge.net.